Key words
reference levels - dose optimization - whole-body CT - reference mAs
Introduction
Due to ongoing technical advances and the further development of established methods
in radiology, there is enormous potential for reducing radiation exposure.
Since the X-ray Ordinance came into effect on 9/1/1973 as a federal ordinance, it
has regulated radiation protection for patients and examiners. For a long time, exposure
for diagnostic purposes was regulated simply by the ALARA principle (as low as reasonably
achievable) and there were no concrete exposure restrictions for radiology examinations.
The introduction and application of dose reference values were recommended for the
first time in 1996 by the International Commission on Radiological Protection (ICRP)
[1]. One year later the European Atomic Energy Community (EURATOM) defined diagnostic
reference levels (DRLs) as a measure for optimizing radiation protection in “patient
protection guidelines” [directive 97/43/ EURATOM] and then confirmed them in the new
guidelines 2013/59/EURATOM [2]. Directive 97/43/ EURATOM requires all EU member states to include diagnostic reference
levels in their national radiation protection laws and to ensure that these values
are regularly reviewed. In radiography and interventional radiology, DRLs are defined
as dose values in diagnostic and interventional applications for typical examinations
in patients with standard dimensions or in standard phantoms using generally defined
equipment. In 1999, the European Commission published guidelines with precise recommendations
for introducing DRLs defining the weight of the “standard patient” as 70 ± 3 kg. In
these guidelines, the European Commission also recommends using a mean dose value
of at least ten unselected patients separately for every X-ray device in place of
the standard patient dose and comparing these values to the relevant DRLs [3].
With inclusion in the amendment to the X-ray Ordinance dated 6/18/2002, the DRLs became
established for the first time in German (national) law and they must be used as a
basis in diagnostic examinations in individuals (§ 16 paragraph 1 sentence 3 of the
X-ray Ordinance) [4]. According to § 16 paragraph 1 sentence 3 of the X-ray Ordinance, the Federal Agency
for Radiation Protection is responsible for creating and publishing reference values
This was performed for the first time on 8/5/2003 in Federal Register No. 143 [4]. The medical authorities are responsible for ensuring compliance with the DRLs for
patient radiation exposure [5]. According to § 17a paragraph 1 sentence 3 no. 2 of the X-ray Ordinance, “constant,
unjustified exceeding of these values” must be reported to the responsible regional
authorities so that an on-site inspection can be conducted and recommendations for
reducing radiation exposure can be made in cooperation with the medical authorities.
The Federal Agency for Radiation Protection is responsible for updating the DRLs at
regular intervals based on the exposure values of the equipment operators reported
annually by the medical authorities. The latest publication of the updated DRLs for
diagnostic and interventional X-ray procedures appeared on June 22, 2016 and these
values were reviewed at the start of 2017 by the medical authorities [6]. The previous update of the DRLs was published on June 22, 2010 by the Federal Agency
for Radiation Protection [7]. The DRLs are based on the 75th percentiles of the distribution of the mean reported
patient exposure values and do not represent limit values for individual procedures
involving radiation or for patients. The corresponding DRLS must not be exceeded by
the mean patient exposure value of at least 10 unselected patients for the particular
examination type on a unit. The DRLs are specified as the volume CT dose index (CTDIVol) and dose length product (DLP) for computed tomography and as the dose area product
(DAP) for radiography and interventional radiology. The DRLs published for the first
time by the Federal Agency for Radiation Protection on June 22, 2010 were already
significantly less than the previously valid reference values for most examinations
[7]
[8]. The current DRLs are even lower and are also significantly more differentiated.
The equipment operator is responsible for checking whether the own DAP, CTDIVol and DLP values satisfy the new requirements and for initiating suitable measures
if necessary so that any necessary corrective measures can be implemented to ensure
compliance with the new DRLs. Moreover, the lowest possible radiation exposure must
be ensured as a function of the state of the art and under consideration of all conditions
of the individual case. In addition, it must be assumed that the radiation exposure
of the German population as a result of radiology examinations can be further reduced
since both the patient dose and thus also the DRLs will be lowered in future updates
in the long term and under consideration of technical developments.
The goal of this study was to review the current dose values on the basis of a polytrauma
whole-body CT unit operated in the clinical routine in the emergency room of a university
radiology institute (Diagnostic and Interventional Radiology) in light of the new
DRLs, to identify possibilities for optimization, and to additionally reduce the mean
exposure values by means of simple optimization steps. In particular, polytrauma whole-body
CT examinations were used for this study because fast and precise clinical and diagnostic
imaging methods are essential for patient care. Comparable “whole-body” screening
tends to be performed in the case of malignancies in patients with advanced age or
possibly with poor prognoses. However, polytrauma patients are often young, e. g.
cyclists and motorcyclists involved in an accident, and people with sports injuries
or work injuries (e. g. fall from a great height ≥ 3 meters). Therefore, diagnostic
image quality should be achieved with the lowest possible radiation exposure due to
the possible biological damage to tissue (e. g. malignant diseases) induced by ionizing
radiation which usually only occurs several years after radiation exposure.
Materials and Methods
The exposure values for anonymized examinations performed on a polytrauma whole-body
CT unit (SOMATOM Sensation Open (2011), Siemens, Erlangen, Germany) with the software
(Somaris/5 syngo CT 2014A) for the months prior to publication of the new DRLs were
taken from the Picture Archiving and Communication System (PACS) and the radiology
information system (RIS) for this study. Based on these exposure values, the mean
values for the DLP and the CTDIVol were calculated and compared to the old and new DRLs.
The CT unit used here is a 24-row unit, the nominal single collimation is 1.2 mm and
the nominal total collimation is 28.8 mm. A voltage of 120 kV and a pitch of 0.65
are used. A body protocol is used for the polytrauma whole-body CT examinations, i. e.,
a 32-cm test phantom (“body phantom”), and a form filter is used for the trunk. Tube
current modulation is performed during the CT examination in an angle-dependent manner
using a biplanar modulation technique. The polytrauma whole-body CT examinations are
routine examinations performed approximately 400 times per year. The applied protocol
was created in collaboration with an application specialist of the manufacturer.
The images were acquired in a standardized manner using the spiral technique from
the base of the skull to the symphysis. A contrast agent (Ultravist® 370, Bayer Vital, Leverkusen, Germany) was injected intravenously following a biphasic
injection protocol [9]. After the first administration of 50 ml of contrast agent at an injection rate
of 3.5 ml/s, the second bolus of 80 ml of contrast agent was injected after a delay
of 30 s with an injection rate of 4.5 ml/s followed by 50 ml of NaCl also with an
injection rate of 4.5 ml/s. 60 seconds after the first application of contrast agent,
the spiral technique begins. Axial reconstruction is performed using the soft tissue
window technique with a slice thickness of 5 mm and using the bone window technique
with a slice thickness of 3 mm. An additional reconstruction using the lung window
technique was performed for the thorax with a slice thickness of 5 mm. Multiplanar
reconstructions are generated using the soft tissue window technique in sagittal and
coronal orientation with a slice thickness of 5 mm and using the bone window technique
in sagittal orientation with a slice thickness of 3 mm.
The CT unit being used does not allow iterative image reconstruction which can be
used to reduce the necessary radiation exposure while maintaining image quality using
computationally intensive image reconstruction algorithms. With iterative image reconstruction,
a dose reduction of up to approx. 75 % can be achieved [10]. However, in the case of a significant dose reduction (> 40 %), there is a risk
that lesions with low contrast enhancement can no longer be detected [11]. Therefore, other suitable optimization options had to be sought following the realization
that the calculated mean dose values were in compliance with the old reference values
but were higher than the new DRLs. Possibilities for reducing radiation exposure while
maintaining diagnostic image quality by simply changing CT imaging parameters were
developed and implemented in collaboration between physicians and physicists. The
slice-dependent mAs reference value (referred to as the “mAs reference value” in the
following) was reduced from 165 mAs to 130 mAs. This reference value determines image
quality and can be accessed by users, i. e., they can perform the change and are not
reliant on the manufacturer. The mAs reference value is specified per rotation and
on this CT unit is based on a 75–80 kg patient (standard patient as defined by the
manufacturer). Based on this mAs reference value, the tube current modulation is performed
as a function of the patient attenuation (patient diameter). In the case of the unit
used here, this is achieved in an angle-dependent manner by a biplanar (double) tube
current modulation on the one hand in the z-direction based on the topogram using
the patient-specific attenuation profile and on the other hand in the x- and y-directions
(lateral and posterior) during the scan. This means that the dose arriving at the
detector is detected and the effective mAs value listed in the patient protocol is
regulated up or down based on the “mAs reference vale”. Reduction of the mAs reference
value results in a reduction in dose but at the same time in an increase in image
noise.
Mean values consisting of 100 examinations before and after optimization of the system
were used for the evaluation. The calculated values were compared with the old and
the new DRLs and were analyzed. A DLP of 1798 mGy · cm according to the old DRLs and
a DLP of 1330 mGy · cm according to the new DRLs were assumed for the examination
on the polytrauma whole-body CT unit from the base of the skull to the symphysis.
For this purpose, the specified reference DLP values for the facial bones (sinusitis),
thorax, abdomen, and pelvis according to the old DRLs were added. Since the specified
DRLs for the facial bones are based on the 16-cm test phantom (“head phantom”), this
value could not be easily added to the remaining DRLs that are based on the 32-cm
test phantom. This value was converted using the phantom factors of the unit so that
it was decreased from 100 mGy · cm to 48 mGy · cm. The DLP reference value for the
torso examination region (thorax + abdomen + pelvis) was added to the DLP reference
value for the neck examination region according to the new DRLs. Since the specified
reference values for the two added examination regions are based on the “body phantom”,
the DLPs can be easily added. However, addition of the individual reference values
for the various examination regions according to both the old and the new DRLs results
in overlapping of the reference values according to the data in the guidelines of
the German Medical Association [12].
The size and weight of the patients was taken from the hospital information system
(HIS) and the body mass index (BMI) of the patients was determined on the basis of
this data. The patients were then categorized according to the individual degrees
of obesity as defined by the WHO [13] so that this information could be used for evaluation if patients greatly exceeded
and negatively influenced the mean values for DLP and CTDIVol due to a high BMI.
In the case of patients without corresponding data in the HIS, conclusions about their
BMI were made based on visual impressions and examination of the subcutaneous fat
tissue on the CT images. Since this was performed without technical tools based on
the CT images, uncertainty regarding the estimated BMI cannot be completely ruled
out.
The various subgroups of degrees of obesity according to the WHO definition with a
patient number > 10 both before and after optimization were examined separately in
greater detail. In particular, attention was paid to the presence of metallic implants.
For objective assessment of image quality, the grayscale values representing the attenuation
of X-rays in tissue (Hounsfield units, HU) in the lung, liver, and aortic arch were
determined for all evaluated examinations. Although CT units are HU-calibrated, the
possibility of significant noise caused by a change was to be ruled out in this study
by checking the mean HU values. In addition, the signal-to-noise ratio (SNR) was determined
based on the mean signal intensity PSignal and the mean noise signal in an area of 10 × 10 pixels [14]. Every examination included three regions of interest: ROI1 in the lung, ROI2 in
the aortic arch, and ROI3 in the liver.
Visual image analysis of the examinations was then performed using the Likert scale
(0 – non-diagnostic, 1 – poor visualization, 2 – moderate visualization, 3 – good
visualization, 4 – excellent visualization) [15]
[16]
[17]. Image quality was assessed visually by two radiologists with 21 and 7 years of
professional experience. Examinations were evaluated in a randomized and anonymized
manner so that it was not clear whether the examinations were performed before or
after the parameter change. For all individual assessments by the two observers, the
mean value was calculated separately for the CT examinations before and after the
parameter change to achieve a better comparison. A two-sided t-Test was then performed
both for the objective assessment and for the visual assessment of image quality to
check the data for significant differences.
Results
The dose averaging analysis shows that both the old and the new DRLs are satisfied
in the CT examinations performed after the reduction of the mAs reference value from
165 mAs to 130 mAs while the old DRLs are satisfied but the new DRLs are exceeded
prior to the parameter change.
[Fig. 1] provides an overview of the mean values for the CT examinations performed on the
polytrauma whole-body CT unit in the emergency room with comparison of the old and
the new DRLs [Fig. 1].
 Fig. 1 Mean DLP values for CT examinations from the base of the skull to the symphysis performed
on a polytrauma whole-body CT unit before and after reduction of the “mAs reference
value”.
Fig. 1 Mean DLP values for CT examinations from the base of the skull to the symphysis performed
on a polytrauma whole-body CT unit before and after reduction of the “mAs reference
value”.
This graphic shows that the values for the CT examinations performed after the change
in mAs reference value was significantly less than the old and slightly less than
the new DRLs. Therefore, the DLP values after the parameter change (mean value 1319.98 ± 463.16 mGy · cm)
correspond to approx. 71.4 % of the old DRLs and approx. 99.2 % of the new DRLs. The
mean value for the CT examinations performed prior to the parameter change (1774.96 ± 608.78
mGy · cm) corresponds to approx. 95.9 % of the old DRL but would exceed the new DRL
by approx. 33.5 %. The CTDIvol values for the examinations performed after optimization are 14.32 ± 4.48 mGy, while
the CTDIvol before optimization has a mean value of 18.01 ± 4.54 mGy. The distribution of values
for DLP (A) and CTDIvol (B) in relation to the CT examinations before and after lowering of the mAs reference
value is shown in a graphic in [Fig. 2]. The average scan length was 92.76 ± 13.06 cm (minimum: 62.94 cm; maximum 142.94 cm)
in CT examinations performed after the parameter change and 94.83 ± 15.44 cm (minimum:
76.34 cm; maximum 147.44 cm) in CT examinations performed before the parameter change.
 Fig. 2 Frequency distribution of patients based on degrees of obesity according to the WHO
definition. Patients undergoing CT examinations before and after the change of the
mAs reference value.
Fig. 2 Frequency distribution of patients based on degrees of obesity according to the WHO
definition. Patients undergoing CT examinations before and after the change of the
mAs reference value.
The t-test for the dose values for the examinations performed prior to and after reduction
of the mAs reference value shows that the radiation exposure could be significantly
reduced (p < 0.0000 001) by the parameter change.
There is a striking difference between the lowest and the highest value of the dataset
for both the CT examinations performed before dose optimization and those performed
after. Some outliers that greatly exceed the DRL are due to the presence of metallic
implants in the patients. However, these extreme values are due in most cases to extremely
overweight patients who greatly exceed the standard patient weight of 70 ± 3 kg as
defined in the EURATOM “patient protection guidelines”.
[Fig. 3] shows a boxplot of the distribution of patients according to the degrees of obesity
as defined by the WHO for CT examinations with an mAs reference value of 130 and with
a value of 165 mAs. It shows that the majority of patients were overweight, i. e.,
over the weight of 70 ± 3 kg defined by the European Commission as the “standard patient”
in the CT examinations both before and after the parameter change, thus negatively
affecting the mean dose value. Approx. 73 % of patients were overweight in the examinations
prior to dose optimization, while approx. 65 % of patients were overweight in the
CT examinations after reduction of the mAs reference value.
 Fig. 3 Boxplot of the comparison of DLP and CTDIvol for CT examinations before and after
the change of the mAs reference value.
Fig. 3 Boxplot of the comparison of DLP and CTDIvol for CT examinations before and after
the change of the mAs reference value.
Due to the different distribution of patient BMI in the two groups, the patients were
classified in subgroups according to degree of obesity as defined by the WHO and the
subgroups with more than 10 patients before and after the reduction of the mAs reference
value were examined more closely. This included the following degrees of obesity:
“normal weight”, “obesity class I”, and “obesity class II”.
This evaluation within the individual degrees of obesity shows that the mean DLP and
CTDIvol values for the CT examinations performed before and after the optimization steps
are significantly lower than the valid DRLs. The values for examinations performed
after the parameter change are significantly less than the values for examinations
performed prior to the parameter change. Therefore, the mean values for examinations
with an mAs reference value of 130 are 1030.97 ± 207.00 mGy · cm for the DLP and 11.44 ± 2.11 mGy
for CTDIvol at a scan length of 89.92 ± 2.79 cm (minimum: 81.28 cm; maximum 94.36 cm). In examinations
with an mAs reference value of 165 mAs, the values are 1345.97 ± 217.98 mGy · cm for
the DLP and 14.36 ± 2.46 mGy for CTDIvol at a scan length of 93.62 ± 2.67 cm (minimum: 88.79 cm; maximum 98.31 cm). A graphic
representation of the distribution of the values for DLP (A) and CTDIvol (B) in normal-weight patients is provided in [Fig. 4].
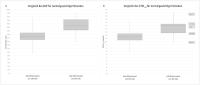 Fig. 4 Boxplot of the comparison of DLP and CTDIvol for CT examinations before and after
the change of the mAs reference value in patients with “normal weight”.
Fig. 4 Boxplot of the comparison of DLP and CTDIvol for CT examinations before and after
the change of the mAs reference value in patients with “normal weight”.
The calculated values for DLP and CTDIvol for patients in obesity class I are below the relevant DRLs for CT examinations performed
both before and after the parameter change. At a scan length of 91.53 ± 14.14 cm (minimum:
61.48 cm; maximum 106.42 cm), the values for DLP (1275.07 ± 267.73 mGy · cm) and for
CTDIvol (14.04 ± 2.58 mGy) for examinations with an mAs reference value of 130 were significantly
lower than the values for examinations with an mAs reference value of 165 (DLP: 1644.28 ±
398.46 mGy · cm, CTDIvol: 16.78 ± 3.01 mGy, scan length: 93.68 ± 12.29 cm (minimum: 81.62 cm; maximum 132.48 cm)).
A detailed representation of the distribution of the values for patients in obesity
class I is shown in [Fig. 5]. The evaluation of the subgroup of patients in obesity class II showed that the
values after the optimization steps for DLP (1573.27 ± 442.29 mGy · cm) and for CTDIvol (17.63 ± 3.98 mGy) at a scan length of 89.52 ± 16.57 cm (minimum: 62.94 cm; maximum
142.94 cm) were significantly below the values for DLP (1385.84 ± 447.38 mGy · cm)
and CTDIvol (19.5 ± 3.77 mGy) prior to optimization at an average scan length of 92.98 ± 14.91 cm
(minimum: 80.32 cm; maximum 131.00 cm). [Fig. 6] shows a graphic of the distribution of DLP and CTDIvol for patients in obesity class II.
 Fig. 5 Boxplot of the comparison of DLP and CTDIvol for CT examinations before and after
the change of the mAs reference value in patients in obesity class I.
Fig. 5 Boxplot of the comparison of DLP and CTDIvol for CT examinations before and after
the change of the mAs reference value in patients in obesity class I.
 Fig. 6 Boxplot of the comparison of DLP and CTDIvol for CT examinations before and after
the change of the mAs reference value in patients in obesity class II.
Fig. 6 Boxplot of the comparison of DLP and CTDIvol for CT examinations before and after
the change of the mAs reference value in patients in obesity class II.
The calculated values for the objective assessment of the image quality showed no
significant differences between examinations performed before and after the parameter
change with respect to grayscale values and signal-to-noise ratio ([Table 1]).
Table 1
Mean values of the gray levels (HU) and SNR for the assessed anatomical structures
for CT examinations before and after the reduction of the “mAs reference value”, as
well as the p-values of the t-Test for significance.
|
mAs reference value of 165 mAs
|
mAs reference value of 130 mAs
|
two-sided t-test (p-value)
|
|
anatomical structure
|
Ø Grayscale values (HU)
|
Ø SNR
|
Ø Grayscale values (HU)
|
Ø SNR
|
Grayscale values
|
SNR
|
|
lung
|
–833
|
108.24
|
–827
|
112.08
|
0.43
|
0.72
|
|
aortic arch
|
341
|
59.27
|
343
|
56.13
|
0.70
|
0.22
|
|
liver
|
68
|
12.35
|
67
|
11.07
|
0.35
|
0.21
|
The mean grayscale values for CT examinations in the lung were –833 HU prior to dose
optimization and –827 HU after optimization (p = 0.43) The mean values for the grayscale
values in the aortic arch were 341 HU at an mAs reference value of 165 mAs and 343
HU (p = 0.70) at an mAs reference value of 130 mAs. Only minimal differences regarding
the mean values before and after the parameter change (68 HU before and 67 HU (p = 0.35)
after reduction of the mAs reference value) were also seen in the liver. There was
also no significant difference between the CT examinations performed before and after
dose optimization regarding the signal-to-noise ratio values. In the lung the SNR
after the parameter change (mean value 112.08) was slightly better than in the examinations
before the parameter change (mean value 108.24) (p = 0.72). In the aortic arch and
the liver, the SNR in the examinations performed prior to the parameter change was
slightly higher than in the subsequent examinations with an mAs reference value of
130 mAs. The SNR value in the aortic arch was 59.27 prior to the reduction of the
mAs reference value and 56.13 after the change (p = 0.22). For the liver the signal-to-noise
ratio values were 12.35 prior to the parameter change and 11.07 (p = 0.21) after the
parameter change.
The visual assessment of image quality by two radiologists using the Likert scale
showed relatively identical ratings of image quality before and after dose optimization,
thus indicating that the diagnostic image quality was not affected by the adjustment
of the mAs reference value ([Fig. 7a, b]). The CT scan images with 3.85 evaluation points at an mAs reference value of 165 mAs
and with 3.82 evaluation points (p = 0.57) at an mAs reference value of 130 also did
not show any significant differences with respect to the ability to assess image quality.
 Fig. 7 CT images before a and after b the dose optimization in two different patients using the soft tissue and bone window
technique.
Fig. 7 CT images before a and after b the dose optimization in two different patients using the soft tissue and bone window
technique.
Discussion
The new DRLs are defined by the Federal Agency for Radiation Protection based on the
75th percentiles of the average dose values reported by equipment operators to the
medical authorities and are updated at regular intervals, with the last update having
been performed on June 22, 2016. This concept will result in a reduction of patient
radiation exposure in the long-term as long as technical developments allow further
dose reduction. Approx. 25 % of the dose values reported by equipment operators exceed
the new reference values according to the DRL update from June 22, 2016 so that equipment
operators must reduce the radiation exposure for every examination type in which the
mean dose values exceed the new DRLs. Optimization of the examination technique by
changing the imaging parameters is often already sufficient to lower the radiation
exposure enough to satisfy the DRLs. In addition to optimization of the imaging parameters,
this use of differently weighted protocols, adapted to the clinical condition of the
patient, is an interesting possibility for dose reduction [18]. However, strict monitoring of the image quality is necessary to ensure diagnostic
image quality despite the dose reduction. If the mean radiation exposure cannot be
reduced to less than the DRLs, service technicians employed by the equipment manufacturer
and/or the medical authority need to be involved or in extreme cases an equipment
upgrade or even replacement of the equipment is necessary.
This study shows that a significant reduction of radiation exposure is possible even
in the case of CT equipment of older generations without iterative image reconstruction
in the case of suitable adjustment of the examination parameters under consideration
of the required image quality. Although the majority of patients (65–70 %) in the
CT examinations evaluated here were overweight and thus exceeded the “standard patient”
body weight of 70 ± 3 kg defined by the European Commission, the radiation exposure
could be reduced by approx. 25.5 % and thus reduced to less than the new DRLs by lowering
the mAs reference value.
However, since the addition of the individual reference values for the various examination
regions results in overlapping of the reference values according to the specifications
of the guidelines of the German Medical Association, the actual reduction of the radiation
exposure is probably slightly smaller.
Therefore, there is an overlap region of a few centimeters between the cervicothoracic
junction and the aortic arch for the neck (facial bones to aortic arch) and torso
(thorax + abdomen + pelvis) examination regions according to the new DRLs so that
it can be assumed that the DRL is slightly lower than the calculated DLP value of
1330 mGy · cm.
For the facial bone (upper edge of the frontal sinus to the chin) and thorax examination
regions, there is a region between the chin and cervicothoracic junction that is not
taken into consideration by the old DRLs but is scanned in whole-body examinations.
However, the thorax and abdomen examination regions (overlap region between the dome
of the diaphragm and the dorsal recess of the diaphragm) and abdomen and pelvis examination
regions (overlap region between the aortic bifurcation and pelvic floor) result in
small (≤ 10 cm) to medium (≤ 20 cm) overlapping of the reference values according
to the specifications of the guidelines of the German Medical Association [12]. As a result of this overlapping of the reference values, the calculated DLP value
of 1798 1798 mGy · cm for the DRL is slightly high.
The comparison with other current studies on CT units with the option of iterative
image reconstruction yielded similar DLP and CTDIvol values [19]. However, the study did not provide any data regarding the weight or BMI of the
included patients so that it is difficult to determine whether only patients with
the weight of a “standard patient” or also overweight patients were included in the
study. Since the DRLs relate to a “standard patient”, evaluating all values by adding
the dose values of both normal-weight and overweight patients to calculate an average
value usually results in significantly higher exposure values. This is also seen when
evaluating the results for DLP and CTDIvol in the subgroups according to the degrees of obesity defined by the WHO. Due to the
different distribution of patient BMI in the two groups, the patients were classified
in subgroups according to degree of obesity as defined by the WHO and the subgroups
with more than 10 patients before and after the reduction of the mAs reference value
were examined more closely. This included the following degrees of obesity: “normal
weight”, “obesity class I”, and “obesity class II”.
This evaluation within the individual degrees of obesity shows that the mean DLP and
CTDIvol values for the CT examinations performed before and after the optimization steps
are significantly lower than the valid DRLs. The average dose values of patients with
“normal weight” are significantly below the DRLs, while the dose values for patients
in “obesity class I” are barely less than the DRLs. In patients in “obesity class
II”, the dose values already clearly exceed the DRLs. The values for examinations
performed after the parameter change are significantly less than the values for examinations
performed prior to the parameter change. Consequently, as a result of the high number
of overweight patients in an obesity class of I or higher in this study, the values
are only barely less than the new DRLs even after the parameter change. In light of
the fact that the BMI of patients without weight and size information in the HIS was
determined based on visual impressions and examination of the subcutaneous fat tissue
on the CT scan images, slight uncertainty regarding the calculation of the BMI cannot
be completely ruled out. Due to the relatively large range of the individual degrees
of obesity, this uncertainty is only relevant in the case of patients with a BMI near
the limit between two degrees of obesity and this was not seen in the patients in
this study. However, limits must also be taken into consideration in calculated BMIs
in clinical practice. Since BMI calculation is independent of sex and age and there
is no differentiation between lean body mass, muscle mass, and fat mass, there can
be limitations regarding the exactness of BMI also in this case [20]. Consequently, the uncertainty in the determination of BMI based on visual impressions
and the evaluation of subcutaneous fat tissue is so minimal compared to arithmetically
calculated BMI that the exactness of the classification to the individual degrees
of obesity was not affected.
For this study, the exposure values of patients who greatly exceeded the weight of
the “standard patient” were included in the calculation of the mean dose value, while
exceeding of the DRLs in such cases is recorded in the monitoring and evaluation by
the medical authority and the Federal Agency for Radiation Protection as justified
exceeding of the DRLs. The polytrauma CT unit that was used here is characterized
by a particularly large gantry diameter (82 cm). This design is supposed to simplify
positioning of severely injured patients and facilitates access to patients. However,
the greater distance between the X-ray tube and the detector results in the need for
a higher dose compared to equipment with a smaller diameter in order to generate images
of the same quality. The visual assessment of image quality showed comparable image
quality without significant differences between the quality of CT scan images acquired
before and after the parameter change. This is also the case for signal-to-noise ratio
as a parameter for the objective assessment of image quality which has already become
established in previous studies in various regions for the evaluation of CT scan images
[21]
[22]. Based on the results of the visual and objective evaluation of image quality and
with respect to the slightly lower values compared to the new DRLs, a further dose
reduction based on suitable parameter changes is possible as long as diagnostic image
quality according to the ALARA principle can be ensured.
In addition to the possibility to reduce radiation exposure while maintaining diagnostic
image quality using simple optimization steps like adjustment of the examination parameters,
there is also the possibility of independent dose management that exceeds the legal
requirements.
If the mean dose values are less than the current DRLs during the review by the medical
authority, the medical authority does not issue a warning even in the event of a continuous
increase in exposure values over a longer period of time. Consequently, changes in
radiation exposure resulting from small changes in parameters in the course of operation
can go unnoticed. By analyzing the own archived exposure values and reviewing and
comparing them with the dose applied to date, it is possible to detect dose deviations
in a timely fashion, to identify causes, and to implement suitable measures. Thus,
radiation exposure can now be controlled on a continuous basis as required by the
X-ray Ordinance instead of only on a retrospective basis by the medical authority.
However, documentation of the type of examination, the applied dose, the X-ray unit
being used, and the weight of the patient being examined is particularly relevant
here. This study highlights the potential for operators of X-ray equipment to review
their own archived exposure values in order to optimize the applied dose and for the
purpose of quality assurance and active dose reduction.
-
Optimization of the examination technique, e. g. by changing imaging parameters, is
often sufficient to reduce radiation exposure enough to satisfy the DRLs while still
ensuring diagnostic image quality.
-
By implementing suitable optimization steps, the DRLs can be satisfied under consideration
of diagnostic image quality even in the case of CT equipment of older generations
without iterative image reconstruction.
-
Analyzing, reviewing, and comparing the own archived exposure values shows the potential
to optimize the applied dose and to use this for the own quality assurance and active
dose management.


