

Subscribe to RSS
DOI: 10.1055/a-1719-1463
More Than Detection of Adenocarcinoma – Indications and Findings in Prostate MRI in Benign Prostatic Disorders
Bildgebung jenseits des Karzinoms – Indikationen und Befunde der MRT im Rahmen benigner ProstataveränderungenAuthors

Abstract
Background Multiparametric MRI of the prostate has become a fundamental tool in the diagnostic pathway for prostate cancer and is recommended before (or after negative) biopsy to guide biopsy and increase accuracy, as a staging examination (high-risk setting), and prior to inclusion into active surveillance. Despite this main field of application, prostate MRI can be utilized to obtain information in a variety of benign disorders of the prostate.
Methods Systematic bibliographical research with extraction of studies, national (German) as well as international guidelines (EAU, AUA), and consensus reports on MRI of benign disorders of the prostate was performed. Indications and imaging findings of prostate MRI were identified for a) imaging the enlarged prostate, b) prostate MRI in prostatic artery embolization, c) imaging in prostatitis and d) imaging in congenital anomalies.
Results and Conclusions Different phenotypes of the enlarged prostate that partly correlate with severity of symptoms are discussed. We provide an overview of the different types of prostatitis and possible imaging findings, highlighting abscesses as a severe complication. The most common congenital anomalies of the prostate are utricular cysts, whereas anomalies like aplasia, hypoplasia, and ectopia are rare disorders. Knowledge of indications for imaging and imaging appearance of these conditions may improve patient care and enhance differential diagnosis.
Key Points:
-
Current guidelines do not implement indications for mpMRI apart from prostate carcinoma.
-
MRI can distinguish different anatomical phenotypes of prostatic enlargement.
-
Prostatic artery embolization represents a valuable treatment option in cases of symptomatic benign prostatic enlargement.
-
Different forms of prostatitis exist and may mimic prostate carcinoma in MRI.
-
MRI can be used to evaluate anatomical prostate anomalies.
Citation Format
-
Oerther B, Sigle A, Franiel T et al. More Than Detection of Adenocarcinoma – Indications and Findings in Prostate MRI in Benign Prostatic Disorders. Fortschr Röntgenstr 2022; 194: 481 – 490
Zusammenfassung
Hintergrund Die multiparametrische MRT der Prostata bildet einen der Grundsteine im diagnostischen Vorgehen zur Erkennung des Prostatakarzinoms. Sie wird vor Biopsie (oder nach negativer Biopsie mit fortbestehendem Karzinomverdacht), zur Erhöhung der diagnostischen Genauigkeit, als Staging (im Hochrisiko-Setting) und vor Einschluss in die Active Surveillance empfohlen. Außerhalb dieser etablierten Indikationen bietet die MRT jedoch weiteren Nutzen bei benignen Krankheitsbildern der Prostata.
Methodik Es erfolgte eine systematische Literaturrecherche mit Datenextraktion aus Studien und aktuellen deutschen sowie internationalen Guidelines (EAU, AUA) bezüglich benigner Erkrankungen der Prostata. Hieraus ergaben sich Indikationen und bildgebende Charakteristika im Rahmen von a) benigner Prostatavergrößerung, b) Prostataarterienembolisation, c) Prostatitis and d) kongenitalen anatomischen Varianten.
Ergebnisse und Schlussfolgerung Es werden verschiedene Phänotypen der vergrößerten Prostata vorgestellt, deren Bildcharakteristika teilweise mit dem klinischen Beschwerdebild korrelieren. Wir bieten einen Überblick über die verschiedenen Formen der Prostatitis, speziell über die intraprostatische Abszedierung als deren schwerwiegende Komplikation und die jeweiligen Charakteristika in der MRT. Die häufigste anatomische Aberration der Prostata stellt die Utriculuszyste dar. Anlageanomalien wie die glanduläre Aplasie, Hypoplasie und Ektopie gehören zu den selteneren Erscheinungsbildern. Die Kenntnis über Bildgebungsindikation und die bildmorphologischen Charakteristika der genannten Erkrankungen können zur Verbesserung der Patientenversorgung und genaueren Differenzialdiagnostik beitragen.
Kernaussagen:
-
Aktuelle Leitlinien implizieren keine Indikationen für die multiparametrische MRT der Prostata außerhalb der Diagnostik des Prostatakarzinoms.
-
Eine Differenzierung verschiedener anatomischer Phänotypen der benignen Prostatavergrößerung ist mittels MRT möglich.
-
Prostataarterienembolisation stellt eine effektive Therapieoption im Rahmen einer symptomatischen Prostatavergrößerung dar.
-
Verschiedene Formen der Prostatitis kommen als Differenzialdiagnose des Prostatakarzinoms in der MRT infrage.
-
Anomalien der Prostata oder Samenblasen können mittels MRT dargestellt werden.
Key words
multiparametric MRI - prostate carcinoma - prostatitis - prostatic artery embolization - prostate enlargement - prostatic anomaliesIntroduction
In recent years, multiparametric MRI of the prostate (mpMRI) has successively been implemented in the process of clinically significant prostate cancer detection [1], active surveillance [2], and relapse diagnosis [3]. National and international guidelines recommend mpMRI in combination with consecutive MRI-guided targeted and systematic biopsy in order to minimize false-negative results in biopsy-naïve patients [4]. There is also consensus for the indication of mpMRI prior to targeted biopsy after previous negative systematic biopsy and prior to placing a patient under active surveillance [4] [5] [6]. Further indications for mpMRI are the evaluation of local tumor expansion and extraprostatic infiltration, staging of high-risk tumors prior to therapy [5], evaluation of tumor extent prior to focal therapy [5] and image-guided radiotherapy [IGRT] [7]. The diagnostic accuracy of mpMRI for the detection of clinically significant cancer has been extensively studied. A recent meta-analysis reports a pooled sensitivity of 87 % and a pooled specificity of 74 % for the standardized reporting lexicon for mpMRI [8], PI-RADS (prostate imaging reporting and data system), with version 2.1 being the most recent edition [9].
Despite this major field of application, prostate MRI can be employed as a diagnostic modality for various other, benign conditions. In this review, we provide an overview of the use of prostate MRI for enlarged prostate imaging, prostate artery embolization imaging, prostatitis imaging, and imaging of congenital anomalies. If applicable, we refer to recommendations of (German) national guidelines and international guidelines (EAU and AUA). We do not review the imaging of malignancies other than adenocarcinoma as these entities have been discussed in detail before [10].
Imaging the enlarged prostate
Definitions and guidelines for imaging
In this manuscript, we follow the terminology used in the German S2e guideline “Diagnostic and differential diagnosis of benign prostate syndrome (BPS)”. An update of the guideline is currently in progress. The term benign prostate syndrome (BPS) refers to the triad of lower urinary tract symptoms (LUTS), benign prostatic enlargement (BPE), and bladder outlet obstruction (BOO) [11]. BPE is defined as an increase in prostate volume (> 25 ml, although different cut-off values have been proposed) due to benign prostatic hyperplasia (BPH). BPH is a histopathological diagnosis and is commonly used incorrectly synonymously with BPS, although only 25–50 % of patients with BPH will eventually develop LUTS over time. Additionally, BPH is often used incorrectly for an enlarged prostate diagnosed with imaging alone. BOO is defined as a reduced rate of urine flow and an increase in detrusor pressure, irrespective of cause [12]. Benign prostatic obstruction (BPO) represents BOO due to BPE [13].
LUTS comprise both irritative symptoms such as high frequency of urination or urge incontinence and obstructive symptoms like decreased peak urine velocity or terminal dribbling. LUTS can be caused by pathologies other than BPE/BOO, e. g. by infection, structural anatomical aberrations or neurogenic disorders. For a comprehensive review of LUTS, refer to the guidelines of the National Institute for Health and Care Excellence (NICE) [14]. English-speaking countries specify the diagnosis of LUTS due to BOO on the basis of BPO/BPE by referring to “LUTS suggestive of BPH” [11] [12]. Only in 50 % of cases will BPH eventually result in BPE [14]. On the other hand, BPE is not a necessary condition for BPO (patients with small prostates may suffer from symptoms due to musculostromal hyperplasia) [15].
Typical indications for imaging in the assessment of BPS are measurement of prostate size and examination of the presence of an intravesical prostatic lobe, for which guidelines suggest transrectal (TRUS) or transabdominal suprapubic ultrasound [13]. It is explicitly stated that cross-sectional imaging can be employed when already available [12]. However, the acquisition of new cross-sectional images of the prostate is currently not implemented in the diagnostic algorithm of LUTS/BPS [12].
MRI offers excellent soft tissue contrast and different prostatic zones can be reliably distinguished and accurately measured [16]. Quantification of the exact prostate volume, exclusion of prostate cancer prior to therapy of an enlarged prostate and detection of pathologies leading to LUTS are promising use cases for mpMRI that have not yet been implemented in current guidelines. It is recommended to estimate prostate volume by measurement of the maximum longitudinal and anterior-posterior diameter on a mid-sagittal image and measurement of the maximum transverse diameter on axial images with the ellipsoid formula (D1 × D2 × D3 × 0.52) [9]. Furthermore, manual and automated segmentation [17] may be employed.
Classification of phenotype
The zonal anatomy of the prostate (differentiating transition zone, peripheral zone, central zone, periurethral glands, and anterior fibromuscular stroma) has been established by McNeal [18]. In the case of an enlarged prostate, Wasserman proposed a phenotypical classification, taking into account in which part (or combination of parts) the enlargement originates [15]. The MRI classification [15] is based on an ultrasound classification [19]. Subtypes of BPH phenotypes may lead to specific symptoms – the AUA has suggested additional research in “disease ‘phenotypesʼ and […] better disease definitions (e. g. […] patient phenotypes relative to urologic symptom profiles)” [15]. We provide an overview of proposed phenotypes in [Fig. 1]. The reported distribution of Wasserman types was 63 % type 1 and 31 % type 3 (after exclusion of type 0 cases) in Wasserman et al. 2015 [15]. According to the authors and to our own clinical experience, Wasserman type 2 occurs more infrequently. The majority of patients can thus be described with only two phenotypes, compare to [Fig. 2]. When enlarged, the transition zone is referred to as lateral lobes and the periurethral glands as the median (retrourethral) lobe [19].

Abb. 1 Phänotypische Klassifikation der Prostata nach Wassermann. Grün: normale Kontur der Prostata, rot: Urethra, braun: Trigonum. a Typ 0: Volumen ≤ 25 ml, kaum/keine zonale Vergrößerung. b Typ 1: bilaterale Vergrößerung der Transitionszone (blau). Bei höhergradiger Vergrößerung dorsale Verlagerung der Urethra. c Typ 2: Vergrößerung des retrourethralen Lobus. Bei höhergradiger Vergrößerung anteriore Verlagerung der Urethra. Anhebung des Trigonums. d Typ 3: Kombination der Typen 1 und 2. e Typ 4: gestieltes, hyperplastisches Gewebe mit Ursprung aus den submukösen Anteilen der Urethra mit Protrusion in die Harnblase. Keine Anhebung des Trigonums (Typ 5: Typ 4 + entweder Typ 1 oder Typ 2, nicht abgebildet). f Typ 6: Subtrigonale ektope Hyperplasie. Alle anderen Kombinationen werden als Typ 7 subsummiert.

Abb. 2 a Typ 1 nach Wassermann, ausschließlich Vergrößerung der Transitionszone. b Typ 2 nach Wassermann, ausschließlich Vergrößerung des retrourethralen Lobus. c Typ 3 nach Wassermann, Vergrößerung der Transitionszone und des retrourethralen Lobus. Typ 1 und Typ 3 stellen die am häufigsten vorkommenden Ausprägungstypen dar.
Two different tissues contribute to hyperplasia of the prostate and therefore to symptoms of BOO on the basis of BPH: glandular/epithelial tissue and stromal tissue [19]. Predominant hyperplasia of glandular tissue leads to mechanical compression of the urethra and the bladder neck, referred to as the static effect. Hyperplasia of stromal tissue leads to an increase in muscle tone, referred to as the dynamic effect [19]. There is evidence that MRI can distinguish between these forms of hyperplasia, with epithelial hyperplastic changes having a high signal in T2-weighted images and stromal hyperplastic changes having a low signal [20], refer to [Fig. 3]. Although this knowledge could hypothetically influence treatment options (e. g., better response to α1-receptor antagonists in cases with predominantly stromal hyperplasia), this approach has not been sufficiently investigated.

Abb. 3 a Axiale T2w. b Koronare T2w. Glanduläre hyperplastische Veränderungen der Transitionszone zeigen eine hohe Signalintensität (durchgezogene Pfeile), stromale hyperplastische Veränderungen zeigen eine niedrige Signalintensität (gestrichelte Pfeile).
Over the past two decades, an intravesical protrusion of enlarged prostatic tissue has been proven to be a clinically relevant morphological feature [21]. For example, a trial without a catheter in the case of acute urinary retention related to BPE is more likely to fail when intravesical protrusion is > 10 mm [22]. The extent of intravesical protrusion (> 10 mm versus ≤ 10 mm) is correlated with the severity of BOO in cases with BPE [23], compare to [Fig. 4a]. A protrusion > 10 mm also predicts poorer response to treatment with tamsulosin in patients with LUTS due to BPO compared to patients with a protrusion ≤ 10 mm [24]. Measurement of intravesical prostatic protrusion (IPP) is mentioned in the current EAU guideline [13] as a potentially “feasible option to infer BPO in men with LUTS”, and “the role of IPP as a noninvasive alternative to pressure flow studies (PFS) in the assessment of male LUTS remains under evaluation” [13]. AUA guidelines refer to ultrasound-based evaluation of IPP as optional during the clinical workup [12].

Abb. 4 a Intravesikale Protrusion der Prostata (IPP, gestrichelte Linie) wird rechtwinklig zur erwarteten physiologischen Ebene des Harnblasenbodens (durchgezogene Linie) gemessen. b Der intraprostatische Winkel der Urethra (PUA) beschreibt den Winkel zwischen proximalem und distalem Abschnitt der prostatischen Urethra (durchgezogene Linie) in der paramedianen Sagittalebene.
Several studies investigated the correlation of the prostatic urethral angle (PUA) with symptoms due to BOO/LUTS in cases with BPE. PUA is defined as the angle between the proximal and distal part of the prostatic urethra measured on a mid-sagittal image, compare to [Fig. 4b]. The angulation point is the proximal part of the verumontanum [25]. A common quantification tool for the severity of symptoms in BPS is the international prostatic symptoms score (IPSS). Two studies that assessed PUA in MRI (mid-sagittal T2-weighted images) did not demonstrate a significant correlation of PUA with the IPSS score [26] – with one study acknowledging the usage of an endorectal coil as a possible source of bias due to deformation of the prostate and the prostatic urethra [27]. Other studies using ultrasound as imaging modality reported significant associations of PUA with IPSS, BOO severity, and peak urine flow rate [25] [28] [29]. A commonly reported cut-off value for an increased PUA is ≥ 35° [25]. PUA measurement is mentioned in the EAU guidelines as an experimental diagnostic tool for noninvasive pressure-flow testing [13]. However, there is also a strong recommendation not to offer noninvasive testing as an alternative to PFS for the diagnosis of BOO.
MRI of the prostate before and after prostatic artery embolization
Performing multiparametric MRI of the prostate before a planned prostatic artery embolization (PAE) serves to detect clinically significant prostate cancer, to determine the size of the prostate, and to visualize the zonal anatomy. Preprocedural imaging of the prostatic arteries helps interventional radiologists to reduce procedure time and the risk of embolization of surrounding organs [30]. Vessel imaging can be performed with DSA combined with cone-beam CT, CT angiography, or MR angiography [30] [31] [32].
If there are PI-RADS 3–5 findings in the patient's prostate, these have to be clarified before PAE by biopsy. The size of the prostate and certain characteristics of the zonal anatomy are prognostic factors for the clinical success of PAE, which should be addressed in the pre-procedure informed consent discussion. The larger the total prostate and the transition zone, the better the clinical success [33]. With an ROC analysis, a threshold value of 39 mL for the total prostate volume was calculated as a guide for a minimum size of the prostate to be treated [33]. Patients with a dominant transition zone and large BPH nodes benefit more from PAE than patients without a dominant transition zone and large BPH nodes [34]. The calculation of the quotient of transition zone volume/total prostate volume showed better clinical success for values > 0.45 with a sensitivity of 85 % and a specificity of 75 % [35]. It was also shown that the size of the median lobe is positively correlated with the clinical success of PAE [36]. IPP is significantly reduced by PAE [37]. Measurement of IPP and PUA is mentioned in the current position paper of the German Society of Interventional Radiology (DeGIR) on PAE in the pre-procedure evaluation. Measurement in follow-up exams is possible in the case of special interest [38].
One day after PAE the anatomy in the transition zone can be delineated more poorly on T2w images than before PAE [39]. In addition, T1w hyperintensities are found as surrogate markers for hemorrhagic necrosis in almost half of cases [39]. Furthermore, the diffusion-weighted and the DCE-MRI images show further signs of ischemia with diffusion restriction and severely reduced vascularization [39], compare to [Fig. 5]. 6 months after PAE, the changes seen in the diffusion-weighted and DCE-MRI images are less distinct and signs of fibrotic remodeling, especially of the transition zone, can be found on T2w images [39]. Parameters that enable an inference from the initial MRI changes 1 day after PAE to the clinical outcome could not be identified [39]. However, another study showed that 87 % of patients with clinical success of PAE had ischemic areas on DCI-MRI images [40]. Furthermore, when evaluating an MRI examination of the prostate after PAE, the continually decreasing volume of the prostate after successful embolization should be taken into account and seems to have reached the nadir after 6 months [41]. After 12 months, morphological stability is reached [38]. The DeGIR position paper states useful clinical control intervals of 1–3 months, 6 months, and 12 months after PAE. In the post-procedural setting, MRI is an option to control treatment success [38].

Abb. 5 Multiparametrische MRT der Prostata vor PAE (obere Reihe) und einen Tag nach PAE (untere Reihe): Die anatomischen T2w-Sequenzen (erste Spalte) zeigen posttherapeutisch eine unschärfere Demarkierung und Berandung der Transitionszone. Deutlich progrediente Diffusionsrestriktion in den diffusionsgewichteten Sequenzen (zweite und dritte Spalte) als Surrogatparameter für ein zytotoxisches Ödem. Das pharmacokinetic parameter mapping (kep; errechnet aus den Signalintensitäten der dynamischen Kontrastmittelsequenzen; vierte Spalte) als Surrogatparameter für Vaskularisation ist einen Tag posttherapeutisch deutlich regredient.
Imaging in prostatitis
Prostatitis can be divided into three subgroups according to symptoms and etiology. Patients with acute bacterial prostatitis (ABP) usually suffer from abruptly-onsetting voiding symptoms, diffuse perineal pain (which may be associated with defecation) and fever. Chronic bacterial prostatitis (CBP) is defined by pain in the perineal region for a period of three months or more. Lastly, chronic pelvic pain syndrome (CPPS) describes a non-bacterial form of chronic prostatitis with similar symptoms [42].
European guidelines recommend distinguishing bacterial prostatitis from CPPS according to the National Institute of Diabetes, Digestive and Kidney diseases (NIDDK) and National Institutes of Health (NIH) classification [43]. Although it is a very common diagnosis, bacterial infection is only proven in around 10 % of prostatitis cases [44]. E. coli are the predominant pathogens in patients with acute bacterial prostatitis [45]. Chronic bacterial prostatitis is caused by a wider spectrum of pathogens, including atypical bacteria. One study found that in 74.2 % of patients with symptoms of chronic prostatitis there was an underlying infectious etiology. Although E. coli is often regarded as the most common pathogen, the authors found infections with C. trachomatis in 37.2 %, T. vaginalis in 10.5 % and U. urealyticum in 5 % of the cases, whereas E. coli accounted for only 6.6 % [46]. CPPS per definition is an abacterical condition with a mostly unknown etiology with immunological dysfunction, neuropathic pain, and difficult to detect infections such as interstitial cystitis, as well as other possibilities being discussed.
There are no recommendations on a standardized diagnostic algorithm, but the diagnostic basis consists of urine dipstick testing (U-Stix), mid-stream urine culture, and DRE [47]. Dipstick testing for nitrite and leukocytes has a positive predictive value of 95 % and a negative predictive value of 70 % in patients with ABP [48]. On DRE, the prostate may appear swollen and tender. Additionally, blood cultures in the case of fever and prostate-specific antigen levels can be taken into consideration. When testing for CBP, the four-glass Meares and Stamey test is established as the diagnostic tool of choice [49]. It is furthermore suggested to take urethral samples in order to rule out atypical pathogens such as C. trachomatis and others [46].
Transrectal ultrasound (TRUS) can be helpful to detect complications such as endoprostatic abscesses but is not recommended as a first-line diagnostic tool for prostatitis due to its limited sensitivity [50]. PSA levels are only increased in 60 % of ABP and 20 % of CBP and therefore offer “no practical diagnostic information in prostatitis” [51]. In MR imaging, prostatitis can occur as a focal or diffuse pattern of low T2 signal intensity with low to moderate diffusion restriction and corresponding early avid contrast enhancement [52]. [Fig. 6] provides an example case of ABP. First-line therapy consists of oral application of culture-guided antibiotic treatment. In cases of ABP an empirical regiment until pathogen identification or parenteral antibiotic treatment of systemically-ill patients can be considered [53].

Abb. 6 28-jähriger Patient mit akut bakterieller Prostatitis. Er wurde mit perinealen Schmerzen und schmerzempfindlicher Prostata in der digital rektalen Untersuchung vorstellig. Der PSA-Wert betrug 12.2 ng/ml. Es erfolgte eine MRT zum Ausschluss von Komplikationen. Es zeigte sich eine diffuse Signalabsenkung der peripheren Zone in T2w (a) sowie diffuse Kontrastmittelaufnahme (b) und diffuse Diffusionsrestriktion in den diffusionsgewichteten Sequenzen (c, d). Kein Nachweis von fokalen Läsionen oder intraprostatischen Abszessen. Befundverbesserung und PSA-Abfall nach dreiwöchiger Antibiotikatherapie.
Prostatic abscesses are severe complications in prostatitis and, according to EAU guidelines, can be detected by TRUS or “imaging studies”, thus including MRI. Vice versa, prostatic microabscesses can indicate prostatitis when other imaging criteria are missing. Similar to manifestations in other locations, endoprostatic abscesses appear as mostly circumscribed lesions with a T2w-hyperintense signal, peripheral contrast enhancement, and diffusion restriction [54], compare to [Fig. 7]. Treatment can either be conservative when abscesses remain under 1 cm in diameter or interventional (e. g. aspiration, drainage) in the case of greater abscesses [55].

Abb. 7 50-jähriger Patient mit Klebsiella pneumonia-Sepsis. Der Patient wurde vorstellig mit pelviner Schmerzsymptomatik, in diesem Rahmen Durchfühung einer MRT zum Ausschluss eines Infektfokus. Es imponierten intraprostatische Flüssigkeitskollektionen bilateral (T2w, a, Pfeile). Zudem randständiges Kontrastmittelenhancement, passend zu Abszessformationen (b).
Granulomatous prostatitis [GP] is a rare type of prostatic inflammation (1–3 % of cases of benign prostatic inflammation) due to a variety of causes. While primary GP is often idiopathic, secondary causes may be urinary tract infections, surgical interventions, biopsy, and BCG instillation – an established treatment option for superficial urothelial bladder carcinoma. When dealing with nonspecific GP, which represents most cases, the disease is mainly self-limiting and requires only symptomatic treatment [56] [57] [58]. GP occurs both in young and old patients, with the greatest prevalence between 50–70 years and a mean age of 62–63 years [59] [60]. Incidence rates of prostatitis are highest between the third and fifth decades of life and from the seventh decade onwards [61]. Imaging shows either a diffuse or nodular low T2 signal compared to normal tissue, sometimes with extracapsular extensions, diffusion restriction, and early, often prolonged peripheral contrast enhancement [57] [62], compare to [Fig. 8]. Histopathologically, lesions appear as centrally caseating necrosis corresponding to low signal intensities in the center of the lesions in post-contrast imaging [62]. Small cystic components within the lesions are described in a few cases. The disease can be barely distinguishable from malignancies as radiological features are overlapping [57]. Hence, follow-up examinations and histopathological confirmation through biopsy in unclear cases to rule out PCa appear to be adequate diagnostic pathways, although guidelines do not offer specific recommendations.

Abb. 8 MRT eines 59-jährigen Patienten mit gesichertem Gleason-7a-Tumor im Rahmen des Stagings. Der PSA-Wert betrug 6 ng/ml. Es imponiert eine T2w-hypointense Läsion (a) mit Diffusionsrestriktion (b) in der posterolateralen peripheren Zone links (durchgezogene Pfeile in a und b), entsprechend dem bekannten Karzinomfokus. Zudem inzidenteller Befund einer exophytischen Läsion der Harnblase (durchgezogene Pfeile in c, T2w) mit Verdacht auf ein Transitionszellkarzinom (TCC). Das Karzinom wurde histopathologisch bestätigt, hiernach Resektion und BCG-Instillation. Eine Kontrolle mittels MRT 8 Monate später zeigt mehrere neue intraprostatische Läsionen mit Diffusionsrestriktion (e, gestrichelte Pfeile. f randständige Kontrastmittelaufnahme), passend zu der Diagnose einer granulomatösen Prostatitis.
Although mpMRI has a high sensitivity for prostate cancer detection, it sometimes lacks specificity, partly due to the above-mentioned conditions. A recent study found that quantitative imaging analysis of mpMRI could reliably differentiate prostatitis, which represents the non-neoplastic condition with imaging features closest to those of prostate cancer, from prostate cancer [63]. It is stated that the combination of several quantitative imaging parameters, among other apparent diffusion coefficient (ADC) values, pharmacokinetic parameters, and time to peak (TTP) enhancement can achieve a total overall diagnostic accuracy of 92.7 %. Also, signal intensity–time curves may help distinguish between the two conditions.
Congenital anomalies of the prostate
The prostate gland and the bulbourethral glands develop from the urogenital sinus, whereas the seminal vesicles (SV) and the ejaculatory duct (ED) arise from the Wolffian ducts. There are no guidelines (EAU, AUA) for the evaluation of prostatic congenital anomalies. Imaging in those cases remains a physician’s individual decision.
Congenital anatomic anomalies of the prostate gland such as agenesis, hypoplasia, cysts and ectopia are rare conditions. Just like anomalies of the seminal vesicles, they often appear in combination with other anomalies of the urogenital system [64]. For example, agenesis of the prostate gland can be associated with testicular feminization, ambiguous genitalia, epispadias or hypospadias ([Fig. 9]).
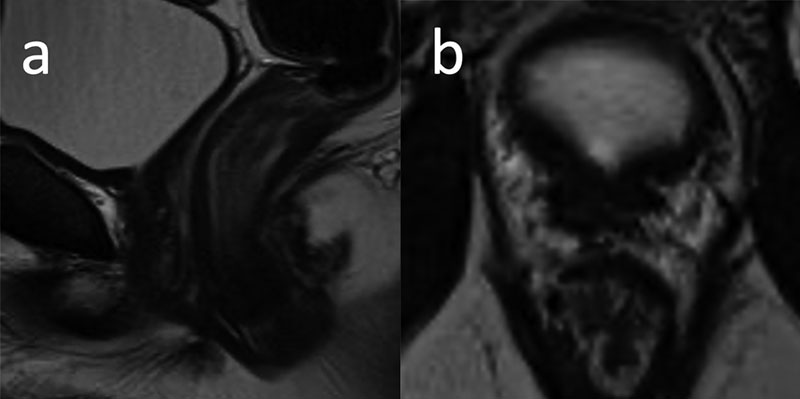
Abb. 9 30-jähriger Patient mit erektiler Dysfunktion und Verdacht auf Dysplasie der Prostata und Samenblasen. Die MRT zeigt sowohl eine Prostataaplasie als auch eine Hypoplasie der Samenblasen (nicht vollständig dargestellt). Entfernung des rechten Hodens nach fulminanter Epididymidis in der Kindheit, der verbliebene linke Hoden imponierte mit 8 ml Volumen hypoplastisch. Zudem imponierte eine Hypospadie in der klinischen Untersuchung. Der PSA-Wert war mit 0.04 ng/ml deutlich erniedrigt, möglicherweise im Rahmen residueller, nicht mittels MRT erfassbarer Drüsenanteile. a T2w sagittale Ebene. b T2w axiale Ebene.
Congenital prostatic cysts originate from either the Müllerian or the Wolffian duct. Anomalies originating from the Müllerian duct are utricular cysts and Müllerian duct cysts, usually located in the prostatic midline. ED and SV cysts on the other hand arise from the Wolffian duct and mostly occur off-midline. ED and SV cysts represent rather uncommon conditions and shall not be discussed further in this article. Another pathology associated with the Wolffian duct is Zinner’s syndrome (ipsilateral ejaculatory duct obstruction, seminal vesicle cysts, and renal agenesis). For further details on the differential diagnosis (including periprostatic lesions like Cowper’s duct cysts) of prostatic cystic lesions, refer to [65].
Utricular cysts are focal, often pear-shaped dilatations within the prostatic utricle (a remnant of the Müllerian duct) and therefore show continuity with the pars prostatica of the urethra. They are located in a median plane within the prostatic gland, compare to [Fig. 10]. Müllerian duct cysts (results of failed focal regression of the Müllerian duct) show no communication with the prostatic urethra, may extend beyond the prostate gland, can grow to large diameters with consecutive irritative urinary symptoms, and typically arise behind the Colliculus seminalis. Utricular cysts and Müllerian duct cysts may be indistinguishable on imaging. Whereas utricular cysts are associated with various genitourinary abnormalities, Müllerian duct cysts usually appear without such associations [65]. Rarely, the otherwise incidental findings may become symptomatic due to infection, urinary retention, bleeding, and impaired fertility [10]. In those cases, MRI of the prostate can be employed for visualization of complex anatomical variants and offers additional information.

Abb. 10 57-jähriger Patient mit Utriculuszyste als Nebenbefund im Rahmen der Detektion eines Prostatakarzinoms. a T2w sagittale Ebene, b T2w axiale Ebene.
In contrast to neoplasms and abscesses, benign cystic lesions show a homogeneous T2 hyperintense signal, a simple internal structure, and no restriction in diffusion-weighted imaging.
Summary
In addition to the detection of clinically significant cancer, prostate MRI can be utilized to obtain information for a variety of benign disorders. In this review, we discuss the use of prostate MRI for imaging of the enlarged prostate, imaging related to prostatic artery embolization, and imaging in prostatitis. We also briefly address imaging in congenital anomalies. Especially in the workup of an enlarged prostate and prostatitis, prostate MRI does not play a central role at the moment according to EAU and AUA guidelines. However, we believe that additional knowledge of clinically significant findings unrelated to established indications for MRI examinations offers additional value for patient care.
Conflict of Interest
The authors declare that they have no conflict of interest.
-
References
- 1 Fütterer JJ, Briganti A, De Visschere P. et al. Can Clinically Significant Prostate Cancer Be Detected with Multiparametric Magnetic Resonance Imaging? A Systematic Review of the Literature. Eur Urol 2015; 68: 1045-1053
- 2 NICE Guidance – Prostate cancer: diagnosis and management: © NICE (2019) Prostate cancer: diagnosis and management. BJU Int 2019; 124: 9-26
- 3 Liauw SL, Pitroda SP, Eggener SE. et al. Evaluation of the prostate bed for local recurrence after radical prostatectomy using endorectal magnetic resonance imaging. Int J Radiat Oncol Biol Phys 2013; 85: 378-384
- 4 EAU Guidelines. Edn. presented at the EAU Annual Congress Amsterdam. 2020. ISBN: 978-94-92671-07-3
- 5 Leitlinienprogramm Onkologie (Deutsche Krebsgesellschaft, Deutsche Krebshilfe, AWMF): Interdisziplinäre Leitlinie der Qualität S3 zur Früherkennung, Diagnose und Therapie der verschiedenen Stadien des Prostatakarzinoms, Langversion 5.1, 2019, AWMF Registernummer: 043/022OL. http://www.leitlinienprogramm-onkolo-gie.de/leitlinien/prostatakarzinom/ (abgerufen am: 18.04.2021)
- 6 Samir S, Taneja MKG, Scott E. et al AUA Clinical Guideline Prostate MRI and MRI-Targeted Biopsy in Patients with Prior Negative Biopsy. 2016 Available from: https://www.auanet.org/guidelines/prostate-mri-and-mri-targeted-biopsy
- 7 Zelefsky MJ, Kollmeier M, Cox B. et al. Improved clinical outcomes with high-dose image guided radiotherapy compared with non-IGRT for the treatment of clinically localized prostate cancer. Int J Radiat Oncol Biol Phys 2012; 84: 125-129
- 8 Park KJ, Choi SH, Kim MH. et al. Performance of Prostate Imaging Reporting and Data System Version 2.1 for Diagnosis of Prostate Cancer: A Systematic Review and Meta-Analysis. J Magn Reson Imaging 2021; 54: 103-112
- 9 Turkbey B, Rosenkrantz AB, Haider MA. et al. Prostate Imaging Reporting and Data System Version 2.1: 2019 Update of Prostate Imaging Reporting and Data System Version 2. Eur Urol 2019; 76: 340-351
- 10 Li Y, Mongan J, Behr SC. et al. Beyond Prostate Adenocarcinoma: Expanding the Differential Diagnosis in Prostate Pathologic Conditions. RadioGraphics 2016; 36: 1055-1075
- 11 Arbeitsgemeinschaft der Wissenschaftlichen Medizinischen Fachgesellschaften (AWMF)-Ständige Kommission Leitlinien. S2e Leitlinie „Therapie des Benignen Prostatasyndroms (BPS)“. 2014 Verfügbar (Zugriff am 18.03.21): https://www.awmf.org/leitlinien/detail/ll/043-035.html
- 12 Foster HE, Barry MJ, Dahm P. et al. Surgical Management of Lower Urinary Tract Symptoms Attributed to Benign Prostatic Hyperplasia: AUA Guideline. J Urol 2018; 200: 612-619
- 13 EAU Guidelines. Edn. presented at the EAU Annual Congress Amsterdam. 2021. ISBN: 978-94-92671-13-4
- 14 National Institute for Health and Care Excellence. (2010). The management of lower urinary tract symptoms in men [NICE Guideline CG97]. https://www.nice.org.uk/guidance/cg97
- 15 Wasserman NF, Spilseth B, Golzarian J. et al. Use of MRI for Lobar Classification of Benign Prostatic Hyperplasia: Potenzial Phenotypic Biomarkers for Research on Treatment Strategies. Am J Roentgenol 2015; 205: 564-571
- 16 Sklinda K, Frączek M, Mruk B. et al. Normal 3T MR Anatomy of the Prostate Gland and Surrounding Structures. Adv Med 2019; 2019: 3040859
- 17 Aldoj N, Biavati F, Michallek F. et al. Automatic prostate and prostate zones segmentation of magnetic resonance images using DenseNet-like U-net. Scientific Reports 2020; 10: 14315
- 18 McNeal JE. The zonal anatomy of the prostate. Prostate 1981; 2: 35-49
- 19 Wasserman NF. Benign Prostatic Hyperplasia: A Review and Ultrasound Classification. Radiologic Clinics of North America 2006; 44: 689-710
- 20 Schiebler ML, Tomaszewski JE, Bezzi M. et al. Prostatic carcinoma and benign prostatic hyperplasia: correlation of high-resolution MR and histopathologic findings. Radiology 1989; 172: 131-137
- 21 Gandhi J, Weissbart SJ, Kim AN. et al. Clinical Considerations for Intravesical Prostatic Protrusion in the Evaluation and Management of Bladder Outlet Obstruction Secondary to Benign Prostatic Hyperplasia. Current Urology 2018; 12: 6-12
- 22 Mariappan P, Brown DJG, McNeill AS. Intravesical Prostatic Protrusion is Better Than Prostate Volume in Predicting the Outcome of Trial Without Catheter in White Men Presenting With Acute Urinary Retention: A Prospective Clinical Study. Journal of Urology 2007; 178: 573-577
- 23 Keqin Z, Zhishun X, Jing Z. et al. Clinical Significance of Intravesical Prostatic Protrusion in Patients with Benign Prostatic Enlargement. Urology 2007; 70: 1096-1099
- 24 Cumpanas AA, Botoca M, Minciu R. et al. Intravesical Prostatic Protrusion Can Be a Predicting Factor for the Treatment Outcome in Patients With Lower Urinary Tract Symptoms Due to Benign Prostatic Obstruction Treated With Tamsulosin. Urology 2013; 81: 859-863
- 25 Ku JH, Ko DW, Cho JY. et al. Correlation Between Prostatic Urethral Angle and Bladder Outlet Obstruction Index in Patients With Lower Urinary Tract Symptoms. Urology 2010; 75: 1467-1471
- 26 Eldib DB, Moussa AS, Sebaey A. Evaluation of different MRI parameters in benign prostatic hyperplasia-induced bladder outlet obstruction. Egyptian Journal of Radiology and Nuclear Medicine 2019; 50: 22
- 27 Guneyli S, Ward E, Peng Y. et al. MRI evaluation of benign prostatic hyperplasia: Correlation with international prostate symptom score. Journal of Magnetic Resonance Imaging 2017; 45: 917-925
- 28 Park YJ, Bae KH, Jin BS. et al. Is Increased Prostatic Urethral Angle Related to Lower Urinary Tract Symptoms in Males with Benign Prostatic Hyperplasia/Lower Urinary Tract Symptoms?. Korean J Urol 2012; 53: 410-413
- 29 Bang WJ, Kim HW, Lee JY. et al. Prostatic Urethral Angulation Associated With Urinary Flow Rate and Urinary Symptom Scores in Men With Lower Urinary Tract Symptoms. Urology 2012; 80: 1333-1337
- 30 Zhang JL, Wang MQ, Shen YG. et al. Effectiveness of Contrast-enhanced MR Angiography for Visualization of the Prostatic Artery prior to Prostatic Arterial Embolization. Radiology 2019; 291: 370-378
- 31 Maclean D, Maher B, Harris M. et al. Planning Prostate Artery Embolisation: Is it Essential to Perform a Pre-procedural CTA?. Cardiovasc Intervent Radiol 2018; 41: 628-632
- 32 Wang MQ, Duan F, Yuan K. et al. Benign Prostatic Hyperplasia: Cone-Beam CT in Conjunction with DSA for Identifying Prostatic Arterial Anatomy. Radiology 2017; 282: 271-280
- 33 Abt D, Müllhaupt G, Mordasini L. et al. Outcome prediction of prostatic artery embolization: post hoc analysis of a randomized, open-label, non-inferiority trial. BJU Int 2019; 124: 134-144
- 34 Little MW, Boardman P, Macdonald AC. et al. Adenomatous-Dominant Benign Prostatic Hyperplasia (AdBPH) as a Predictor for Clinical Success Following Prostate Artery Embolization: An Age-Matched Case-Control Study. Cardiovasc Intervent Radiol 2017; 40: 682-689
- 35 de Assis AM, Maciel MS, Moreira AM. et al. Prostate Zonal Volumetry as a Predictor of Clinical Outcomes for Prostate Artery Embolization. Cardiovasc Intervent Radiol 2017; 40: 245-251
- 36 Bingham GA, Shuttleworth CB, Thomas JL. Discussion On Enlargement Of The Prostate And Its Treatment. The British Medical Journal 1906; 2: 1262-1269
- 37 Lin Y-T, Amouyal G, Thiounn N. et al. Intra-vesical Prostatic Protrusion (IPP) Can Be Reduced by Prostatic Artery Embolization. CardioVascular and Interventional Radiology 2016; 39: 690-695
- 38 Kovács A, Bücker A, Grimm M-O. et al. Position Paper of the German Society for Interventional Radiology (DeGIR) on Prostatic Artery Embolization. Rofo 2020; 192: 835-846
- 39 Franiel T, Aschenbach R, Trupp S. et al. Prostatic Artery Embolization with 250-μm Spherical Polyzene-Coated Hydrogel Microspheres for Lower Urinary Tract Symptoms with Follow-up MR Imaging. J Vasc Interv Radiol 2018; 29: 1127-1137
- 40 Kisilevzky N, Faintuch S. MRI assessment of prostatic ischaemia: best predictor of clinical success after prostatic artery embolisation for benign prostatic hyperplasia. Clin Radiol 2016; 71: 876-882
- 41 Zhang H, Shen Y, Pan J. et al. MRI features after prostatic artery embolization for the treatment of medium- and large-volume benign hyperplasia. Radiol Med 2018; 123: 727-734
- 42 Krieger JN, Nyberg Jr L, Nickel JC. NIH consensus definition and classification of prostatitis. Jama 1999; 282: 236-237
- 43 Alexander RB, Ponniah S, Hasday J. et al. Elevated levels of proinflammatory cytokines in the semen of patients with chronic prostatitis/chronic pelvic pain syndrome. Urology 1998; 52: 744-749
- 44 De La Rosette JJMCH, Hubregtse MR, Meuleman EJH. et al. Diagnosis and treatment of 409 patients with prostatitis syndromes. Urology 1993; 41: 301-307
- 45 Schneider H, Ludwig M, Hossain HM. et al. The 2001 Giessen Cohort Study on patients with prostatitis syndrome--an evaluation of inflammatory status and search for microorganisms 10 years after a first analysis. Andrologia 2003; 35: 258-262
- 46 Skerk V, Krhen I, Schonwald S. et al. The role of unusual pathogens in prostatitis syndrome. Int J Antimicrob Agents 2004; 24 (Suppl. 01) S53-S56
- 47 Lipsky BA, Byren I, Hoey CT. Treatment of bacterial prostatitis. Clin Infect Dis 2010; 50: 1641-1652
- 48 Etienne M, Pestel-Caron M, Chavanet P. et al Performance of the urine leukocyte esterase and nitrite dipstick test for the diagnosis of acute prostatitis. Clin Infect Dis 2008; 46: 951-953 ; author reply 3
- 49 Zegarra Montes LZ, Sanchez Mejia AA, Loza Munarriz CA. et al Semen and urine culture in the diagnosis of chronic bacterial prostatitis. Int Braz J Urol 2008; 34: 30-37 , discussion 8–40
- 50 Doble A, Carter SS. Ultrasonographic findings in prostatitis. Urol Clin North Am 1989; 16: 763-772
- 51 Polascik TJ, Oesterling JE, Partin AW. Prostate specific antigen: a decade of discovery -- what we have learned and where we are going. J Urol 1999; 162: 293-306
- 52 Kitzing YX, Prando A, Varol C. et al. Benign Conditions That Mimic Prostate Carcinoma: MR Imaging Features with Histopathologic Correlation. RadioGraphics 2016; 36: 162-175
- 53 EAU Guidelines. Edn. presented at the EAU Annual Congress Milan Italy. 2021. ISBN: 978-94-92671-13-4
- 54 Singh P, Yadav MK, Singh SK. et al. Case series: Diffusion weighted MRI appearance in prostatic abscess. Indian J Radiol Imaging 2011; 21: 46-48
- 55 Ludwig M, Schroeder-Printzen I, Schiefer HG. et al. Diagnosis and therapeutic management of 18 patients with prostatic abscess. Urology 1999; 53: 340-345
- 56 Kumbar R, Dravid N, Nikumbh D. et al. Clinicopathological Overview of Granulomatous Prostatitis: An Appraisal. J Clin Diagn Res 2016; 10: EC20-EC3
- 57 Lee S-M, Wolfe K, Acher P. et al. Multiparametric MRI appearances of primary granulomatous prostatitis. The British Journal of Radiology 2019; 92: 20180075
- 58 Shukla P, Gulwani HV, Kaur S. Granulomatous prostatitis: clinical and histomorphologic survey of the disease in a tertiary care hospital. Prostate Int 2017; 5: 29-34
- 59 Mohan H, Bal A, Punia RP. et al. Granulomatous prostatitis -- an infrequent diagnosis. Int J Urol 2005; 12: 474-478
- 60 Stillwell TJ, Engen DE, Farrow GM. The Clinical Spectrum of Granulomatous Prostatitis: A Report of 200 Cases. Journal of Urology 1987; 138: 320-323
- 61 Schaeffer AJ. Epidemiology and demographics of prostatitis. Andrologia 2003; 35: 252-257
- 62 Kawada H, Kanematsu M, Goshima S. et al. Multiphase Contrast-Enhanced Magnetic Resonance Imaging Features of Bacillus Calmette-Guérin-Induced Granulomatous Prostatitis in Five Patients. Korean J Radiol 2015; 16: 342-348
- 63 Uysal A, Karaosmanoğlu AD, Karcaaltıncaba M. et al. Prostatitis, the Great Mimicker of Prostate Cancer: Can We Differentiate Them Quantitatively With Multiparametric MRI?. American Journal of Roentgenology 2020; 215: 1104-1112
- 64 Kim B, Kim CK. Embryology, Anatomy, and Congenital Anomalies of the Prostate and Seminal Vesicles. In: Hamm B, Ros PR. editors. Abdominal Imaging. Berlin, Heidelberg: Springer Berlin Heidelberg; 2013: 1797-1812
- 65 Curran S, Akin O, Agildere AM. et al. Endorectal MRI of Prostatic and Periprostatic Cystic Lesions and Their Mimics. American Journal of Roentgenology 2007; 188: 1373-1379
Correspondence
Publication History
Received: 01 July 2021
Accepted: 18 November 2021
Article published online:
26 January 2022
© 2022. Thieme. All rights reserved.
Georg Thieme Verlag KG
Rüdigerstraße 14, 70469 Stuttgart, Germany
-
References
- 1 Fütterer JJ, Briganti A, De Visschere P. et al. Can Clinically Significant Prostate Cancer Be Detected with Multiparametric Magnetic Resonance Imaging? A Systematic Review of the Literature. Eur Urol 2015; 68: 1045-1053
- 2 NICE Guidance – Prostate cancer: diagnosis and management: © NICE (2019) Prostate cancer: diagnosis and management. BJU Int 2019; 124: 9-26
- 3 Liauw SL, Pitroda SP, Eggener SE. et al. Evaluation of the prostate bed for local recurrence after radical prostatectomy using endorectal magnetic resonance imaging. Int J Radiat Oncol Biol Phys 2013; 85: 378-384
- 4 EAU Guidelines. Edn. presented at the EAU Annual Congress Amsterdam. 2020. ISBN: 978-94-92671-07-3
- 5 Leitlinienprogramm Onkologie (Deutsche Krebsgesellschaft, Deutsche Krebshilfe, AWMF): Interdisziplinäre Leitlinie der Qualität S3 zur Früherkennung, Diagnose und Therapie der verschiedenen Stadien des Prostatakarzinoms, Langversion 5.1, 2019, AWMF Registernummer: 043/022OL. http://www.leitlinienprogramm-onkolo-gie.de/leitlinien/prostatakarzinom/ (abgerufen am: 18.04.2021)
- 6 Samir S, Taneja MKG, Scott E. et al AUA Clinical Guideline Prostate MRI and MRI-Targeted Biopsy in Patients with Prior Negative Biopsy. 2016 Available from: https://www.auanet.org/guidelines/prostate-mri-and-mri-targeted-biopsy
- 7 Zelefsky MJ, Kollmeier M, Cox B. et al. Improved clinical outcomes with high-dose image guided radiotherapy compared with non-IGRT for the treatment of clinically localized prostate cancer. Int J Radiat Oncol Biol Phys 2012; 84: 125-129
- 8 Park KJ, Choi SH, Kim MH. et al. Performance of Prostate Imaging Reporting and Data System Version 2.1 for Diagnosis of Prostate Cancer: A Systematic Review and Meta-Analysis. J Magn Reson Imaging 2021; 54: 103-112
- 9 Turkbey B, Rosenkrantz AB, Haider MA. et al. Prostate Imaging Reporting and Data System Version 2.1: 2019 Update of Prostate Imaging Reporting and Data System Version 2. Eur Urol 2019; 76: 340-351
- 10 Li Y, Mongan J, Behr SC. et al. Beyond Prostate Adenocarcinoma: Expanding the Differential Diagnosis in Prostate Pathologic Conditions. RadioGraphics 2016; 36: 1055-1075
- 11 Arbeitsgemeinschaft der Wissenschaftlichen Medizinischen Fachgesellschaften (AWMF)-Ständige Kommission Leitlinien. S2e Leitlinie „Therapie des Benignen Prostatasyndroms (BPS)“. 2014 Verfügbar (Zugriff am 18.03.21): https://www.awmf.org/leitlinien/detail/ll/043-035.html
- 12 Foster HE, Barry MJ, Dahm P. et al. Surgical Management of Lower Urinary Tract Symptoms Attributed to Benign Prostatic Hyperplasia: AUA Guideline. J Urol 2018; 200: 612-619
- 13 EAU Guidelines. Edn. presented at the EAU Annual Congress Amsterdam. 2021. ISBN: 978-94-92671-13-4
- 14 National Institute for Health and Care Excellence. (2010). The management of lower urinary tract symptoms in men [NICE Guideline CG97]. https://www.nice.org.uk/guidance/cg97
- 15 Wasserman NF, Spilseth B, Golzarian J. et al. Use of MRI for Lobar Classification of Benign Prostatic Hyperplasia: Potenzial Phenotypic Biomarkers for Research on Treatment Strategies. Am J Roentgenol 2015; 205: 564-571
- 16 Sklinda K, Frączek M, Mruk B. et al. Normal 3T MR Anatomy of the Prostate Gland and Surrounding Structures. Adv Med 2019; 2019: 3040859
- 17 Aldoj N, Biavati F, Michallek F. et al. Automatic prostate and prostate zones segmentation of magnetic resonance images using DenseNet-like U-net. Scientific Reports 2020; 10: 14315
- 18 McNeal JE. The zonal anatomy of the prostate. Prostate 1981; 2: 35-49
- 19 Wasserman NF. Benign Prostatic Hyperplasia: A Review and Ultrasound Classification. Radiologic Clinics of North America 2006; 44: 689-710
- 20 Schiebler ML, Tomaszewski JE, Bezzi M. et al. Prostatic carcinoma and benign prostatic hyperplasia: correlation of high-resolution MR and histopathologic findings. Radiology 1989; 172: 131-137
- 21 Gandhi J, Weissbart SJ, Kim AN. et al. Clinical Considerations for Intravesical Prostatic Protrusion in the Evaluation and Management of Bladder Outlet Obstruction Secondary to Benign Prostatic Hyperplasia. Current Urology 2018; 12: 6-12
- 22 Mariappan P, Brown DJG, McNeill AS. Intravesical Prostatic Protrusion is Better Than Prostate Volume in Predicting the Outcome of Trial Without Catheter in White Men Presenting With Acute Urinary Retention: A Prospective Clinical Study. Journal of Urology 2007; 178: 573-577
- 23 Keqin Z, Zhishun X, Jing Z. et al. Clinical Significance of Intravesical Prostatic Protrusion in Patients with Benign Prostatic Enlargement. Urology 2007; 70: 1096-1099
- 24 Cumpanas AA, Botoca M, Minciu R. et al. Intravesical Prostatic Protrusion Can Be a Predicting Factor for the Treatment Outcome in Patients With Lower Urinary Tract Symptoms Due to Benign Prostatic Obstruction Treated With Tamsulosin. Urology 2013; 81: 859-863
- 25 Ku JH, Ko DW, Cho JY. et al. Correlation Between Prostatic Urethral Angle and Bladder Outlet Obstruction Index in Patients With Lower Urinary Tract Symptoms. Urology 2010; 75: 1467-1471
- 26 Eldib DB, Moussa AS, Sebaey A. Evaluation of different MRI parameters in benign prostatic hyperplasia-induced bladder outlet obstruction. Egyptian Journal of Radiology and Nuclear Medicine 2019; 50: 22
- 27 Guneyli S, Ward E, Peng Y. et al. MRI evaluation of benign prostatic hyperplasia: Correlation with international prostate symptom score. Journal of Magnetic Resonance Imaging 2017; 45: 917-925
- 28 Park YJ, Bae KH, Jin BS. et al. Is Increased Prostatic Urethral Angle Related to Lower Urinary Tract Symptoms in Males with Benign Prostatic Hyperplasia/Lower Urinary Tract Symptoms?. Korean J Urol 2012; 53: 410-413
- 29 Bang WJ, Kim HW, Lee JY. et al. Prostatic Urethral Angulation Associated With Urinary Flow Rate and Urinary Symptom Scores in Men With Lower Urinary Tract Symptoms. Urology 2012; 80: 1333-1337
- 30 Zhang JL, Wang MQ, Shen YG. et al. Effectiveness of Contrast-enhanced MR Angiography for Visualization of the Prostatic Artery prior to Prostatic Arterial Embolization. Radiology 2019; 291: 370-378
- 31 Maclean D, Maher B, Harris M. et al. Planning Prostate Artery Embolisation: Is it Essential to Perform a Pre-procedural CTA?. Cardiovasc Intervent Radiol 2018; 41: 628-632
- 32 Wang MQ, Duan F, Yuan K. et al. Benign Prostatic Hyperplasia: Cone-Beam CT in Conjunction with DSA for Identifying Prostatic Arterial Anatomy. Radiology 2017; 282: 271-280
- 33 Abt D, Müllhaupt G, Mordasini L. et al. Outcome prediction of prostatic artery embolization: post hoc analysis of a randomized, open-label, non-inferiority trial. BJU Int 2019; 124: 134-144
- 34 Little MW, Boardman P, Macdonald AC. et al. Adenomatous-Dominant Benign Prostatic Hyperplasia (AdBPH) as a Predictor for Clinical Success Following Prostate Artery Embolization: An Age-Matched Case-Control Study. Cardiovasc Intervent Radiol 2017; 40: 682-689
- 35 de Assis AM, Maciel MS, Moreira AM. et al. Prostate Zonal Volumetry as a Predictor of Clinical Outcomes for Prostate Artery Embolization. Cardiovasc Intervent Radiol 2017; 40: 245-251
- 36 Bingham GA, Shuttleworth CB, Thomas JL. Discussion On Enlargement Of The Prostate And Its Treatment. The British Medical Journal 1906; 2: 1262-1269
- 37 Lin Y-T, Amouyal G, Thiounn N. et al. Intra-vesical Prostatic Protrusion (IPP) Can Be Reduced by Prostatic Artery Embolization. CardioVascular and Interventional Radiology 2016; 39: 690-695
- 38 Kovács A, Bücker A, Grimm M-O. et al. Position Paper of the German Society for Interventional Radiology (DeGIR) on Prostatic Artery Embolization. Rofo 2020; 192: 835-846
- 39 Franiel T, Aschenbach R, Trupp S. et al. Prostatic Artery Embolization with 250-μm Spherical Polyzene-Coated Hydrogel Microspheres for Lower Urinary Tract Symptoms with Follow-up MR Imaging. J Vasc Interv Radiol 2018; 29: 1127-1137
- 40 Kisilevzky N, Faintuch S. MRI assessment of prostatic ischaemia: best predictor of clinical success after prostatic artery embolisation for benign prostatic hyperplasia. Clin Radiol 2016; 71: 876-882
- 41 Zhang H, Shen Y, Pan J. et al. MRI features after prostatic artery embolization for the treatment of medium- and large-volume benign hyperplasia. Radiol Med 2018; 123: 727-734
- 42 Krieger JN, Nyberg Jr L, Nickel JC. NIH consensus definition and classification of prostatitis. Jama 1999; 282: 236-237
- 43 Alexander RB, Ponniah S, Hasday J. et al. Elevated levels of proinflammatory cytokines in the semen of patients with chronic prostatitis/chronic pelvic pain syndrome. Urology 1998; 52: 744-749
- 44 De La Rosette JJMCH, Hubregtse MR, Meuleman EJH. et al. Diagnosis and treatment of 409 patients with prostatitis syndromes. Urology 1993; 41: 301-307
- 45 Schneider H, Ludwig M, Hossain HM. et al. The 2001 Giessen Cohort Study on patients with prostatitis syndrome--an evaluation of inflammatory status and search for microorganisms 10 years after a first analysis. Andrologia 2003; 35: 258-262
- 46 Skerk V, Krhen I, Schonwald S. et al. The role of unusual pathogens in prostatitis syndrome. Int J Antimicrob Agents 2004; 24 (Suppl. 01) S53-S56
- 47 Lipsky BA, Byren I, Hoey CT. Treatment of bacterial prostatitis. Clin Infect Dis 2010; 50: 1641-1652
- 48 Etienne M, Pestel-Caron M, Chavanet P. et al Performance of the urine leukocyte esterase and nitrite dipstick test for the diagnosis of acute prostatitis. Clin Infect Dis 2008; 46: 951-953 ; author reply 3
- 49 Zegarra Montes LZ, Sanchez Mejia AA, Loza Munarriz CA. et al Semen and urine culture in the diagnosis of chronic bacterial prostatitis. Int Braz J Urol 2008; 34: 30-37 , discussion 8–40
- 50 Doble A, Carter SS. Ultrasonographic findings in prostatitis. Urol Clin North Am 1989; 16: 763-772
- 51 Polascik TJ, Oesterling JE, Partin AW. Prostate specific antigen: a decade of discovery -- what we have learned and where we are going. J Urol 1999; 162: 293-306
- 52 Kitzing YX, Prando A, Varol C. et al. Benign Conditions That Mimic Prostate Carcinoma: MR Imaging Features with Histopathologic Correlation. RadioGraphics 2016; 36: 162-175
- 53 EAU Guidelines. Edn. presented at the EAU Annual Congress Milan Italy. 2021. ISBN: 978-94-92671-13-4
- 54 Singh P, Yadav MK, Singh SK. et al. Case series: Diffusion weighted MRI appearance in prostatic abscess. Indian J Radiol Imaging 2011; 21: 46-48
- 55 Ludwig M, Schroeder-Printzen I, Schiefer HG. et al. Diagnosis and therapeutic management of 18 patients with prostatic abscess. Urology 1999; 53: 340-345
- 56 Kumbar R, Dravid N, Nikumbh D. et al. Clinicopathological Overview of Granulomatous Prostatitis: An Appraisal. J Clin Diagn Res 2016; 10: EC20-EC3
- 57 Lee S-M, Wolfe K, Acher P. et al. Multiparametric MRI appearances of primary granulomatous prostatitis. The British Journal of Radiology 2019; 92: 20180075
- 58 Shukla P, Gulwani HV, Kaur S. Granulomatous prostatitis: clinical and histomorphologic survey of the disease in a tertiary care hospital. Prostate Int 2017; 5: 29-34
- 59 Mohan H, Bal A, Punia RP. et al. Granulomatous prostatitis -- an infrequent diagnosis. Int J Urol 2005; 12: 474-478
- 60 Stillwell TJ, Engen DE, Farrow GM. The Clinical Spectrum of Granulomatous Prostatitis: A Report of 200 Cases. Journal of Urology 1987; 138: 320-323
- 61 Schaeffer AJ. Epidemiology and demographics of prostatitis. Andrologia 2003; 35: 252-257
- 62 Kawada H, Kanematsu M, Goshima S. et al. Multiphase Contrast-Enhanced Magnetic Resonance Imaging Features of Bacillus Calmette-Guérin-Induced Granulomatous Prostatitis in Five Patients. Korean J Radiol 2015; 16: 342-348
- 63 Uysal A, Karaosmanoğlu AD, Karcaaltıncaba M. et al. Prostatitis, the Great Mimicker of Prostate Cancer: Can We Differentiate Them Quantitatively With Multiparametric MRI?. American Journal of Roentgenology 2020; 215: 1104-1112
- 64 Kim B, Kim CK. Embryology, Anatomy, and Congenital Anomalies of the Prostate and Seminal Vesicles. In: Hamm B, Ros PR. editors. Abdominal Imaging. Berlin, Heidelberg: Springer Berlin Heidelberg; 2013: 1797-1812
- 65 Curran S, Akin O, Agildere AM. et al. Endorectal MRI of Prostatic and Periprostatic Cystic Lesions and Their Mimics. American Journal of Roentgenology 2007; 188: 1373-1379
Abb. 1 Phänotypische Klassifikation der Prostata nach Wassermann. Grün: normale Kontur der Prostata, rot: Urethra, braun: Trigonum. a Typ 0: Volumen ≤ 25 ml, kaum/keine zonale Vergrößerung. b Typ 1: bilaterale Vergrößerung der Transitionszone (blau). Bei höhergradiger Vergrößerung dorsale Verlagerung der Urethra. c Typ 2: Vergrößerung des retrourethralen Lobus. Bei höhergradiger Vergrößerung anteriore Verlagerung der Urethra. Anhebung des Trigonums. d Typ 3: Kombination der Typen 1 und 2. e Typ 4: gestieltes, hyperplastisches Gewebe mit Ursprung aus den submukösen Anteilen der Urethra mit Protrusion in die Harnblase. Keine Anhebung des Trigonums (Typ 5: Typ 4 + entweder Typ 1 oder Typ 2, nicht abgebildet). f Typ 6: Subtrigonale ektope Hyperplasie. Alle anderen Kombinationen werden als Typ 7 subsummiert.
Abb. 2 a Typ 1 nach Wassermann, ausschließlich Vergrößerung der Transitionszone. b Typ 2 nach Wassermann, ausschließlich Vergrößerung des retrourethralen Lobus. c Typ 3 nach Wassermann, Vergrößerung der Transitionszone und des retrourethralen Lobus. Typ 1 und Typ 3 stellen die am häufigsten vorkommenden Ausprägungstypen dar.
Abb. 3 a Axiale T2w. b Koronare T2w. Glanduläre hyperplastische Veränderungen der Transitionszone zeigen eine hohe Signalintensität (durchgezogene Pfeile), stromale hyperplastische Veränderungen zeigen eine niedrige Signalintensität (gestrichelte Pfeile).
Abb. 4 a Intravesikale Protrusion der Prostata (IPP, gestrichelte Linie) wird rechtwinklig zur erwarteten physiologischen Ebene des Harnblasenbodens (durchgezogene Linie) gemessen. b Der intraprostatische Winkel der Urethra (PUA) beschreibt den Winkel zwischen proximalem und distalem Abschnitt der prostatischen Urethra (durchgezogene Linie) in der paramedianen Sagittalebene.
Abb. 5 Multiparametrische MRT der Prostata vor PAE (obere Reihe) und einen Tag nach PAE (untere Reihe): Die anatomischen T2w-Sequenzen (erste Spalte) zeigen posttherapeutisch eine unschärfere Demarkierung und Berandung der Transitionszone. Deutlich progrediente Diffusionsrestriktion in den diffusionsgewichteten Sequenzen (zweite und dritte Spalte) als Surrogatparameter für ein zytotoxisches Ödem. Das pharmacokinetic parameter mapping (kep; errechnet aus den Signalintensitäten der dynamischen Kontrastmittelsequenzen; vierte Spalte) als Surrogatparameter für Vaskularisation ist einen Tag posttherapeutisch deutlich regredient.
Abb. 6 28-jähriger Patient mit akut bakterieller Prostatitis. Er wurde mit perinealen Schmerzen und schmerzempfindlicher Prostata in der digital rektalen Untersuchung vorstellig. Der PSA-Wert betrug 12.2 ng/ml. Es erfolgte eine MRT zum Ausschluss von Komplikationen. Es zeigte sich eine diffuse Signalabsenkung der peripheren Zone in T2w (a) sowie diffuse Kontrastmittelaufnahme (b) und diffuse Diffusionsrestriktion in den diffusionsgewichteten Sequenzen (c, d). Kein Nachweis von fokalen Läsionen oder intraprostatischen Abszessen. Befundverbesserung und PSA-Abfall nach dreiwöchiger Antibiotikatherapie.
Abb. 7 50-jähriger Patient mit Klebsiella pneumonia-Sepsis. Der Patient wurde vorstellig mit pelviner Schmerzsymptomatik, in diesem Rahmen Durchfühung einer MRT zum Ausschluss eines Infektfokus. Es imponierten intraprostatische Flüssigkeitskollektionen bilateral (T2w, a, Pfeile). Zudem randständiges Kontrastmittelenhancement, passend zu Abszessformationen (b).
Abb. 8 MRT eines 59-jährigen Patienten mit gesichertem Gleason-7a-Tumor im Rahmen des Stagings. Der PSA-Wert betrug 6 ng/ml. Es imponiert eine T2w-hypointense Läsion (a) mit Diffusionsrestriktion (b) in der posterolateralen peripheren Zone links (durchgezogene Pfeile in a und b), entsprechend dem bekannten Karzinomfokus. Zudem inzidenteller Befund einer exophytischen Läsion der Harnblase (durchgezogene Pfeile in c, T2w) mit Verdacht auf ein Transitionszellkarzinom (TCC). Das Karzinom wurde histopathologisch bestätigt, hiernach Resektion und BCG-Instillation. Eine Kontrolle mittels MRT 8 Monate später zeigt mehrere neue intraprostatische Läsionen mit Diffusionsrestriktion (e, gestrichelte Pfeile. f randständige Kontrastmittelaufnahme), passend zu der Diagnose einer granulomatösen Prostatitis.
Abb. 9 30-jähriger Patient mit erektiler Dysfunktion und Verdacht auf Dysplasie der Prostata und Samenblasen. Die MRT zeigt sowohl eine Prostataaplasie als auch eine Hypoplasie der Samenblasen (nicht vollständig dargestellt). Entfernung des rechten Hodens nach fulminanter Epididymidis in der Kindheit, der verbliebene linke Hoden imponierte mit 8 ml Volumen hypoplastisch. Zudem imponierte eine Hypospadie in der klinischen Untersuchung. Der PSA-Wert war mit 0.04 ng/ml deutlich erniedrigt, möglicherweise im Rahmen residueller, nicht mittels MRT erfassbarer Drüsenanteile. a T2w sagittale Ebene. b T2w axiale Ebene.
Abb. 10 57-jähriger Patient mit Utriculuszyste als Nebenbefund im Rahmen der Detektion eines Prostatakarzinoms. a T2w sagittale Ebene, b T2w axiale Ebene.