Keywords
erythrophagocytosis - ferroptosis - endothelial cell - thrombosis - uremia
Introduction
Uremic patients are at high risk of venous thromboembolism (VTE), stroke, and acute
coronary syndrome,[1]
[2]
[3] which may represent the predominant cause of mortality.[4] A better understanding of the pathogenesis of thrombotic tendencies in uremia could
help to find novel therapeutic targets to prevent thrombosis in uremia.
Phosphatidylserine, an anionic phospholipid, is usually confined to the inner leaflet
of the cell membrane.[5]
[6] It is externalized to the outer membrane when cell apoptosis is activated. Exposed
phosphatidylserine on cells as a critical “eat me” signal for phagocytes provides
a catalytic surface for the assembly of tenase and prothrombinase complexes.[7]
[8]
[9] Our previous studies had shown that uremic solutes indoxyl sulfate (IS) and indole-3-acetic
acid (IAA) induced eryptosis and enhanced the procoagulant activity of red blood cells
(RBCs) through phosphatidylserine exposure and microparticle release, which contributed
to the hypercoagulable state in uremia.[10]
[11] However, the fate of these phosphatidylserine-exposed RBCs was not investigated.
It is well known that macrophages play critical roles in the clearance of senescent
RBC and recycling iron in physiological processes, which are called erythrophagocytosis.[12] However, in certain clinical situations such as malaria, immunoglobulin G-mediated
hemolytic transfusion reactions, transfusion of storage-damaged RBCs, and uremia,
shortened RBC lifespan and increased or pathologic erythrophagocytosis may make professional
macrophages overwhelmed, dysfunction, and loss.[13]
[14] Endothelial cells (ECs) are amateur phagocytes which exist in a large amount on
the walls of blood vessels and have the potential phagocytotic ability. Recent studies
have reported that ECs have phagocytic properties for lactadherin-opsonized RBC.[15]
[16] In this study, we found that injured or eryptotic RBCs by uremic toxins were engulfed
by vascular ECs (vECs), and then, we investigated the effects of erythrophagocytosis
on ECs.
Ferroptosis is a recently identified iron-dependent cell death characterized by increased
iron-dependent reactive oxygen species (ROS) and lipid peroxides, which is morphologically,
biochemically, and genetically distinct from apoptosis, necroptosis, and autophagy.[17]
[18] Ferroptosis plays an important regulatory role in many diseases such as tumors,
cardiomyopathy, acute kidney injury, and ischemia/reperfusion.[19]
[20]
[21]
[22] However, the role of ferroptosis in the occurrence and development of thrombosis
is currently unknown. In this study, we first demonstrated pathologic erythrophagocytosis
disrupting the homeostasis of iron metabolism and resulting in iron overload, and
subsequently, the increased “free” iron-induced ferroptosis of EC through the Fenton
reaction producing multiple ROS and lipid peroxidation products. Following ferroptosis,
phosphatidylserine was exposed on EC, which enhanced the procoagulant activity of
EC and contributed to the thrombophilic state under the uremic conditions. Our data
showed a relationship between erythrophagocytosis, ferroptosis, and thrombogenesis,
which further explained coagulation disorders, renal anemia, and inflammation complications
in uremic patients.
Materials and Methods
Reagents
Detailed description of all reagents can be found in the [Supplementary Methods] (available in the online version).
Cells and Animal Model
Peripheral blood was drawn from healthy volunteers and approval from the Ethics Committee
of Harbin Medical University according to the Helsinki Declaration was obtained. All
animal studies were approved by the Animal Care Committee of Harbin Medical University
and conformed to the international guidelines on the ethical use of animals. Detailed
information about co-incubation model of uremic RBC and EC in vitro, a uremic rat
model induced by adenine, and flow restriction in the inferior vena cava (IVC) is
available in the [Supplementary Methods] (available in the online version).[23]
[24]
[25]
The following were performed as previously described: phagocytosis assay, flow cytometry,
electron microscopy, confocal microscopy, HE and MSB staining, Western blot, FXa and
prothrombinase assays, thromboelastography testing, malondialdehyde (MDA), glutathione
(GSH), catalase (CAT), H2O2, superoxide dismutase (SOD), and iron quantification assays.[26]
[27] Detailed information about these methods is available in the [Supplementary Methods] (available in the online version).
Statistical Analysis
All values were presented as the mean ± standard deviation. Groups were compared using
the two-tailed Student's test or one-way analysis of variance with Tukey's post hoc
test. Differences with a p-value <0.05 were statistically significant. Statistical analysis was analyzed by GraphPad
Prism 8.0.
Results
Phosphatidylserine-Exposed RBCs Were Engulfed, Degraded, and Eliminated by ECs In
Vitro
To investigate the increased erythrophagocytosis by ECs in uremic conditions, we set
up an in vitro co-incubation model of uremic RBC and cultured EC. Uremic toxin IAA
was used to induce phosphatidylserine exposure on RBCs, and ethanol was used as the
vehicle because IAA was dissolved by ethanol. Phosphatidylserine exposure was detected
through annexin V–FITC binding by confocal microscopy and flow cytometry, respectively.
After 24 hours of incubation, compared with RBCs cultured in Ringer solution (R-RBCs),
20 μM IAA-treated RBCs (I-RBCs) had a significantly higher percentage of annexin V
binding (11.08 ± 0.44% vs. 0.15 ± 0.02%, p < 0.001), and a higher percentage (14.03 ± 1.5%, p < 0.01) in 50 μM IAA ([Supplementary Fig. S1A], available in the online version), which is consistent with our previous studies.[9] Confocal microscopy further showed stronger rings of green fluorescence on the outer
membrane of I-RBCs compared to R-RBCs ([Supplementary Fig. S1B, C], available in the online version). Therefore, in the following co-incubation experiment,
we used the RBCs treated with the maximal level of IAA (50 μM) found in uremic patients.[24] Next, we determined the interaction between uremic RBC and EC in the co-incubation
model. After co-incubation for 6 hours, images of representative confocal microscopy
showed that significantly increased I-RBCs (red) were taken up by ECs (green) compared
with R-RBCs ([Fig. 1A, B]). By flow cytometry, we further quantified the internalization of RBCs by ECs. The
percentage of ECs containing RBCs was 21.47 ± 1.18% in the I-RBC group, which was
significantly higher than that in the R-RBC group (1.9 ± 0.6%, p < 0.001). In addition, I-RBC showed a massively enhanced endocytosis by EC after
lactadherin opsonization (31.78 ± 1.27%, p < 0.001), while the extent of phagocytosis was dramatically suppressed when I-RBCs
were pretreated with annexin V to block the exposed phosphatidylserine (6.83 ± 1.47%,
p < 0.001) ([Fig. 1C]). We further depicted the dynamic phagocytosis process by scanning electron microscopy
(SEM) and transmission electron microscopy (TEM). Representative images of SEM showed
that four I-RBCs were trapped, anchored, and endocytosed by EC ([Fig. 1E]), whereas none of the R-RBC was in contact with the EC during 6 hours of co-culture
([Fig. 1D]). As shown in [Fig. 1F], TEM displayed that the EC was extending the pseudopodia and adhering I-RBC, and
then I-RBC was captured and internalized by EC ([Fig. 1G]). After 12 hours of co-incubation, erythrocytes were digested and degraded into
fragments in EC ([Fig. 1H]). Within 24 hours, nearly all phagocytic intracellular RBCs had disappeared, leaving
only their membrane ruffles or empty vesicles ([Fig. 1I, J]), suggesting that degradation was virtually complete. Taken together, these results
indicated that uremic RBCs were indeed endocytosed by ECs and in a phosphatidylserine-dependent
manner.
 Fig. 1 Phosphatidylserine exposed RBCs were engulfed, degraded, and eliminated by ECs in
vitro. ECs were incubated with R-RBCs and I-RBCs for 6 hours, respectively. After
washing and removing the nonadherent or nonphagocytosed RBCs, immunofluorescence staining
was applied to definitively determine the phagocytosis of RBCs by ECs. RBCs were stained
with CD235a (red). The cytoskeleton and nuclei of ECs were labelled with tubulin (green)
and Hoechst 33342 (blue), respectively. R-RBCs (A) and I-RBCs (B) were taken up or engulfed by ECs. (C) RBCs were stained with 1 μM CMFDA (green) for 30 minutes at room temperature, and
then cocultured with ECs for 6 hours in the presence or absence of 2 nM Lact or 2 nM
AnV. The phagocytic percentage was counted by flow cytometry. All data were representative
of at least three independent experiments and values were expressed as mean ± SD.
Scanning electron microscopy examination of adhered RBCs to the surface of ECs after
6 hours of incubation, several I-RBCs (arrow) were trapped, anchored, and internalizing
by EC (E), whereas none of the R-RBC adhered to EC (D). Transmission electron microscopy images displayed a kinetic process that I-RBCs
were engulfed and degraded in ECs for 24 hours. I-RBC (arrow) was extending the pseudopodia
and adhering to EC (F), and then RBCs (stars) were internalized in EC after 6 hours of coculture (G). (H) After 12 hours of co-incubation, erythrocytes were digested and degraded into fragments
in EC (dotted box). (I) After 24 hours, nearly all phagocytosed intracellular RBCs had disappeared, leaving
only their membranes. (J) Local magnification of RBC membrane ruffles (star) and empty vesicles (triangle)
in EC. AnV, annexin V; EC, endothelial cell; IAA, indole-3-acetic acid; I-RBC, RBCs
cultured in Ringer solution with 50 μM IAA; Lact, lactadherin; R-RBC, RBCs cultured
in Ringer solution; SD, standard deviation.
Fig. 1 Phosphatidylserine exposed RBCs were engulfed, degraded, and eliminated by ECs in
vitro. ECs were incubated with R-RBCs and I-RBCs for 6 hours, respectively. After
washing and removing the nonadherent or nonphagocytosed RBCs, immunofluorescence staining
was applied to definitively determine the phagocytosis of RBCs by ECs. RBCs were stained
with CD235a (red). The cytoskeleton and nuclei of ECs were labelled with tubulin (green)
and Hoechst 33342 (blue), respectively. R-RBCs (A) and I-RBCs (B) were taken up or engulfed by ECs. (C) RBCs were stained with 1 μM CMFDA (green) for 30 minutes at room temperature, and
then cocultured with ECs for 6 hours in the presence or absence of 2 nM Lact or 2 nM
AnV. The phagocytic percentage was counted by flow cytometry. All data were representative
of at least three independent experiments and values were expressed as mean ± SD.
Scanning electron microscopy examination of adhered RBCs to the surface of ECs after
6 hours of incubation, several I-RBCs (arrow) were trapped, anchored, and internalizing
by EC (E), whereas none of the R-RBC adhered to EC (D). Transmission electron microscopy images displayed a kinetic process that I-RBCs
were engulfed and degraded in ECs for 24 hours. I-RBC (arrow) was extending the pseudopodia
and adhering to EC (F), and then RBCs (stars) were internalized in EC after 6 hours of coculture (G). (H) After 12 hours of co-incubation, erythrocytes were digested and degraded into fragments
in EC (dotted box). (I) After 24 hours, nearly all phagocytosed intracellular RBCs had disappeared, leaving
only their membranes. (J) Local magnification of RBC membrane ruffles (star) and empty vesicles (triangle)
in EC. AnV, annexin V; EC, endothelial cell; IAA, indole-3-acetic acid; I-RBC, RBCs
cultured in Ringer solution with 50 μM IAA; Lact, lactadherin; R-RBC, RBCs cultured
in Ringer solution; SD, standard deviation.
ECs Underwent Ferroptosis following Enhanced Erythrophagocytosis
The distinction between ferroptosis and other forms of cell death is the dramatic
morphological changes of mitochondria in ferroptosis. When observing the ultrastructure
of ECs through TEM, compared with the normal mitochondria in ECs without erythrophagocytosis
([Fig. 2A]), we found detailed impairments of mitochondria, including content lost, cristae
reduced or disappeared ([Fig. 2B, C]), increased membrane density, condensed cristae ([Fig. 2D]), and enhanced Fiameng score (a semiquantitative evaluation method of the mitochondrial
ultrastructure) in I-RBC-treated ECs ([Fig. 2E]). To further verify that increased erythrophagocytosis-induced ferroptosis in ECs,
cell viability, ROS, and lipid peroxidation were detected, respectively. We found
that erythrophagocytosis led to significantly decreased viability of ECs, which could
be rescued by ferrostatin-1 (Fer-1) and deferoxamine (DFO), respectively ([Fig. 2F]). In addition, compared to R-RBC-treated EC, there were significantly increased
DCF and C11-Bodipy fluorescence in I-RBC-treated EC after 12 hours of incubation,
which were effectively reduced by treatment with Fer-1 or DFO ([Fig. 2G, H]). These results further indicated that increased erythrophagocytosis led to EC ferroptosis.
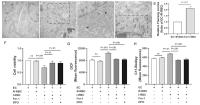 Fig. 2 ECs undergone ferroptosis following enhanced erythrophagocytosis. The ultrastructure
of mitochondria in ECs was analyzed by transmission electron microscopy in the erythrophagocytosis
model. (A) Normal mitochondria in EC without erythrophagocytosis. In our erythrophagocytosis
model, ECs cocultured with I-RBCs exhibit morphological changes of mitochondria around
the internalized RBC fragments including mitochondria integrity impaired, content
lost, cristae reduced (dotted box) (B) and disappeared (C), membrane density increased, and cristae condensed (D). ECs were incubated with each group of RBCs for 12 hours with or without 5 μM Fer-1
or 200 μM DFO. (E) The Fiameng scores were used to evaluate the mitochondrial ultrastructure. (F) The viability of ECs was assessed by the CCK-8 test. Each group of cells was incubated
with DCFH-DA or C11-BODIPY for 30 minutes at 37°C; after washing, the levels of ROS
(G) and lipid peroxidation (H) in ECs were determined by flow cytometry. All data were representative of at least
three independent experiments and values were expressed as mean ± SD. DFO, deferoxamine;
EC, endothelial cell; Fer-1, ferrostatin-1; IAA, indole-3-acetic acid; I-RBC, RBCs
cultured in Ringer solution with 50 μM IAA; R-RBC, RBCs cultured in Ringer solution;
ROS, reactive oxygen species; SD, standard deviation.
Fig. 2 ECs undergone ferroptosis following enhanced erythrophagocytosis. The ultrastructure
of mitochondria in ECs was analyzed by transmission electron microscopy in the erythrophagocytosis
model. (A) Normal mitochondria in EC without erythrophagocytosis. In our erythrophagocytosis
model, ECs cocultured with I-RBCs exhibit morphological changes of mitochondria around
the internalized RBC fragments including mitochondria integrity impaired, content
lost, cristae reduced (dotted box) (B) and disappeared (C), membrane density increased, and cristae condensed (D). ECs were incubated with each group of RBCs for 12 hours with or without 5 μM Fer-1
or 200 μM DFO. (E) The Fiameng scores were used to evaluate the mitochondrial ultrastructure. (F) The viability of ECs was assessed by the CCK-8 test. Each group of cells was incubated
with DCFH-DA or C11-BODIPY for 30 minutes at 37°C; after washing, the levels of ROS
(G) and lipid peroxidation (H) in ECs were determined by flow cytometry. All data were representative of at least
three independent experiments and values were expressed as mean ± SD. DFO, deferoxamine;
EC, endothelial cell; Fer-1, ferrostatin-1; IAA, indole-3-acetic acid; I-RBC, RBCs
cultured in Ringer solution with 50 μM IAA; R-RBC, RBCs cultured in Ringer solution;
ROS, reactive oxygen species; SD, standard deviation.
Erythrophagocytosis-Induced Ferroptosis of ECs via Iron Overload and Amino Acid Metabolism
Disorder
Although increasing evidence suggests that ECs experience ferroptosis following phagocytosis
of uremic RBCs, the underlying mechanism is poorly understood. In human, approximately
80% of heme is present in erythrocytes, and we speculated that iron overload may play
an important role in erythrophagocytosis-induced EC ferroptosis. Therefore, the proteins
that regulated intracellular iron homeostasis were detected. As we expected, there
was significantly higher iron content in ECs that co-incubated with I-RBCs than that
with R-RBCs, whereas the intracellular active iron was decreased in I-RBC-treated
ECs with the addition of DFO to chelate iron, but it was similar between the two groups
when pretreated with Fer-1 ([Fig. 3A]). The level of heme oxygenase-1 (HO-1) protein expression was significantly increased
in I-RBC-treated ECs. Moreover, neither Fer-1 nor DFO could inhibit the upregulated
HO-1 ([Fig. 3B]). Consistent with the increased HO-1 levels, we also found increased ferritin (FTN)
protein levels in the I-RBC-treated ECs, while the expression of FPN responsible for
iron efflux did not change. Furthermore, when I-RBC-treated ECs were incubated with
DFO, FTN significantly decreased, but there was no difference when pretreated with
Fer-1 ([Fig. 3C, D]), suggesting iron overload played a critical role in the ferroptosis of EC triggered
by erythrophagocytosis. By Western blot assay, we found that in addition to iron overload,
I-RBC-treated ECs had decreased levels of glutathione peroxidase 4 (GPX4) and SLC7A11
compared with R-RBC-treated ECs. Moreover, both of the two proteins rescued significantly
following the administration of Fer-1 and DFO ([Fig. 3E, F]), indicating amino acid metabolism disorder also occurred in erythrophagocytosis-triggered
ferroptosis by suppressing the expression of system Xc− and led to a reduced generation of GPX4.
 Fig. 3 Iron overload and amino acid metabolism contributed to erythrophagocytosis-induced
ferroptosis of ECs. ECs were incubated with R-RBC and I-RBC with or without 5 μM Fer-1
(I-RBC + Fer-1 group) or 200 μM DFO (I-RBC + DFO group) for 12 hours, respectively.
(A) Calcein fluorescence assays. ECs were stained with calcein-AM (1 μM) and fluorescence
intensity was measured by flow cytometry. The results were expressed as the mean fold
changes versus untreated ECs (mean ± SD, n = 3 experiments). (B–F) Protein levels of HO-1, FTN, FPN, GPX4, and SLC7A11 in ECs were detected by Western
blotting. The relative density of the protein bands was quantified and normalized
to β-actin (mean ± SD, n = 3 experiments). DFO, deferoxamine; EC, endothelial cell; Fer-1, ferrostatin-1;
FPN, ferroportin; FTN, ferritin; GPX4, glutathione peroxidase 4; HO-1, heme oxygenase-1;
IAA, indole-3-acetic acid; I-RBC, RBCs cultured in Ringer solution with 50 μM IAA;
LIP, labile iron pool; R-RBC, RBCs cultured in Ringer solution; SD, standard deviation.
Fig. 3 Iron overload and amino acid metabolism contributed to erythrophagocytosis-induced
ferroptosis of ECs. ECs were incubated with R-RBC and I-RBC with or without 5 μM Fer-1
(I-RBC + Fer-1 group) or 200 μM DFO (I-RBC + DFO group) for 12 hours, respectively.
(A) Calcein fluorescence assays. ECs were stained with calcein-AM (1 μM) and fluorescence
intensity was measured by flow cytometry. The results were expressed as the mean fold
changes versus untreated ECs (mean ± SD, n = 3 experiments). (B–F) Protein levels of HO-1, FTN, FPN, GPX4, and SLC7A11 in ECs were detected by Western
blotting. The relative density of the protein bands was quantified and normalized
to β-actin (mean ± SD, n = 3 experiments). DFO, deferoxamine; EC, endothelial cell; Fer-1, ferrostatin-1;
FPN, ferroportin; FTN, ferritin; GPX4, glutathione peroxidase 4; HO-1, heme oxygenase-1;
IAA, indole-3-acetic acid; I-RBC, RBCs cultured in Ringer solution with 50 μM IAA;
LIP, labile iron pool; R-RBC, RBCs cultured in Ringer solution; SD, standard deviation.
Ferroptosis Followed by Erythrophagocytosis Enhanced the Procoagulant Activity of
ECs
Since ECs experienced ferroptosis after the uptake of large numbers of RBCs, we considered
that this could disrupt the clotting balance of ECs. To explore whether ferroptosis
enhance the procoagulant activity of ECs, we examined the procoagulant activity of
ECs by one-stage recalcification time assay. As shown in [Fig. 4A], after 12 hours of incubation, the coagulation time of ECs cultured with I-RBCs
was 151.22 ± 10.29 seconds, which significantly reduced when compared with ECs cultured
with R-RBCs (197.07 ± 8.36 seconds, p < 0.001). To understand the role of phosphatidylserine exposure in ferroptosis-induced
procoagulant activity of EC, coagulation inhibition assays were further performed
on EC. The procoagulant activity of ECs was inhibited over 90% by 128 nM lactadherin.
It is well known that one of the important roles of phosphatidylserine is a catalytic
surface for the assembly of FXa and prothrombinase complexes. We further investigated
the capacity of EC to support intrinsic, extrinsic FXa, and thrombin that contribute
to the procoagulant activity. As shown in [Fig. 4B], I-RBC-treated ECs significantly increased the production of the three procoagulant
enzyme complexes compared with R-RBC-treated ECs, which were inhibited by 128 nM lactadherin
up to 90%. Results from inhibition assays further confirmed that phosphatidylserine
played a crucial role in the procoagulant activity of ECs undergoing ferroptosis.
More recent studies have shown that TMEM16F served as phospholipid scramblase and
was upregulated in ferroptosis. Therefore, we also evaluated the expression and role
of TMEM16F in the erythrophagocytosis-induced ferroptosis. We found that I-RBC-treated
ECs exhibited significantly higher TMEM16F expression and phosphatidylserine exposure
compared to ECs with or without cocultured R-RBCs by Western blotting and flow cytometry,
respectively ([Fig. 4C, D]). In addition, confocal microscopy visually demonstrated that TMEM16F expression
(green) and phosphatidylserine exposure (green) increased significantly in the I-RBC-treated
ECs compared with the R-RBC-treated ECs ([Fig. 4E–J]).
 Fig. 4 Ferroptosis followed by erythrophagocytosis enhanced the procoagulant activity of
ECs. ECs were cocultured with R-RBC and I-RBC for 12 hours, respectively. After washing
and removing the nonadherent or nonphagocytosed RBCs, ECs were collected for the one-stage
recalcification time assay. (A) In the absence or presence of 128 nM Lact, coagulation times of 100 μL ECs (103) in each group were shown. Results were displayed as mean ± SD for at least three
independent experiments. (B) Formation and inhibition assays of procoagulant enzyme complexes. FXa and thrombin
production of ECs (103) were shown. Intrinsic FXa formation was measured in the presence of FIXa, FVIII,
and thrombin. Extrinsic FXa production was assessed in the presence of FVIIa. Thrombin
generation was investigated in the presence of FXa and FVa. The capacity of 128 nM
Lact was evaluated to block procoagulant enzyme complexes on ECs. Data are mean ± SD.
(C) ECs were collected and incubated with annexin V- FITC for 30 minutes in the dark,
and then flow cytometry analyzed the phosphatidylserine exposure of ECs. Results were
expressed as mean ± SD. (D) The expression level of TMEM16F in ECs was detected by Western blotting. The relative
density of the protein bands was quantified and normalized to β-actin (mean ± SD,
n = 3). Expression of TMEM16F (green) in ECs was determined by immunofluorescence staining.
The cytoskeleton and nuclei of ECs were labeled with tubulin (red) and Hoechst 33342
(blue), respectively. (E) No TMEM16F staining was found in the R-RBC-treated ECs. (F) Much green fluorescence was visible on ECs after coculturing with I-RBC. (G) The relative fluorescence intensity of TMEM16F. Confocal microscopy images of phosphatidylserine
(green) externalized to the outer membrane of ECs co-incubated with I-RBC (I) or R-RBC (H). (J) The relative fluorescence intensity of phosphatidylserine. EC, endothelial cell;
IAA, indole-3-acetic acid; I-RBC, RBCs cultured in Ringer solution with 50 μM IAA;
Lact, lactadherin; R-RBC, RBCs cultured in Ringer solution; SD, standard deviation.
Fig. 4 Ferroptosis followed by erythrophagocytosis enhanced the procoagulant activity of
ECs. ECs were cocultured with R-RBC and I-RBC for 12 hours, respectively. After washing
and removing the nonadherent or nonphagocytosed RBCs, ECs were collected for the one-stage
recalcification time assay. (A) In the absence or presence of 128 nM Lact, coagulation times of 100 μL ECs (103) in each group were shown. Results were displayed as mean ± SD for at least three
independent experiments. (B) Formation and inhibition assays of procoagulant enzyme complexes. FXa and thrombin
production of ECs (103) were shown. Intrinsic FXa formation was measured in the presence of FIXa, FVIII,
and thrombin. Extrinsic FXa production was assessed in the presence of FVIIa. Thrombin
generation was investigated in the presence of FXa and FVa. The capacity of 128 nM
Lact was evaluated to block procoagulant enzyme complexes on ECs. Data are mean ± SD.
(C) ECs were collected and incubated with annexin V- FITC for 30 minutes in the dark,
and then flow cytometry analyzed the phosphatidylserine exposure of ECs. Results were
expressed as mean ± SD. (D) The expression level of TMEM16F in ECs was detected by Western blotting. The relative
density of the protein bands was quantified and normalized to β-actin (mean ± SD,
n = 3). Expression of TMEM16F (green) in ECs was determined by immunofluorescence staining.
The cytoskeleton and nuclei of ECs were labeled with tubulin (red) and Hoechst 33342
(blue), respectively. (E) No TMEM16F staining was found in the R-RBC-treated ECs. (F) Much green fluorescence was visible on ECs after coculturing with I-RBC. (G) The relative fluorescence intensity of TMEM16F. Confocal microscopy images of phosphatidylserine
(green) externalized to the outer membrane of ECs co-incubated with I-RBC (I) or R-RBC (H). (J) The relative fluorescence intensity of phosphatidylserine. EC, endothelial cell;
IAA, indole-3-acetic acid; I-RBC, RBCs cultured in Ringer solution with 50 μM IAA;
Lact, lactadherin; R-RBC, RBCs cultured in Ringer solution; SD, standard deviation.
Erythrophagocytosis and Ferroptosis Occurred in the Kidney of Uremic Rats
To better understand the mechanisms of thromboembolic disorders in uremia, we established
an adenine-induced animal model of chronic kidney disease. Consistent with previous
reports,[27] 0.75% adenine treatment for 4 weeks was effective in causing chronic kidney disease
in rats. As shown in [Supplementary Table S1] (available in the online version), adenine-treated rats significantly decreased
the body weight, RBC, and hemoglobin, and significantly increased plasma urea, creatinine,
uric acid, and phosphorus compared with control rats, which are in line with the characteristics
of uremia. Likewise, compared with control rats, representative images of HE staining
from kidney of the adenine-treated rats showed the characteristic structural changes
including glomerular injury, tubulointerstitial fibrosis, interstitial inflammatory
infiltrates, tubular distend, and vacuolar degeneration of epithelial cells ([Supplementary Fig. S2A, B], available in the online version). Histological analysis of kidney sections showed
that the number, diameter, and surface area of the glomerulus were markedly reduced
in the adenine-treated group compared to the control group. Compared with the control
group, the renal coefficient (the ratio of the left kidney's weight to its body weight)
was significantly higher in the adenine-treated group ([Supplementary Fig. S2C–F], available in the online version). These results indicated adenine administration
effectively induced uremia in rats. Then, we further explored the association and
underlying mechanisms of erythrophagocytosis, ferroptosis, and thrombogenesis in our
uremic rat model. Representative light microscopy images of a blood vessel in the
kidney showed that multiple erythrocytes were adhered to the vascular wall and internalized
in vEC ([Fig. 5A]) and accompanied by microthrombosis in the microvasculature of the uremic kidney
by MSB staining ([Fig. 5B]). More importantly, we also examined the interaction between RBC and EC inside the
blood vessel by TEM. Representative images showed that the erythrocyte was trapped
and anchored by the EC in the vessel of kidney ([Fig. 5C]), and several erythrocytes were endocytosed and degraded to some fragments by the
EC ([Fig. 5D]). Similarly to that observed in vitro, we found morphological changes of the mitochondria
in the EC, such as cristae reduced and content lost ([Fig. 5E]).
 Fig. 5 Erythrophagocytosis triggered ferroptosis of kidney in the uremic rats. Histological
analyses of the kidney tissue section in three different stainings (HE, MSB, and DAB-enhanced
Prussian blue). (A) Light microscopy image of a blood vessel showed internalization of multiple RBCs
by ECs (indicated by arrow). (B) Representative image of MSB staining showed RBC aggregates and fibrin on the microvasculature
EC surface in the uremic kidney. (C) Transmission electron microscopy image of an erythrocyte trapped and anchored by
EC in the vessel of the uremic kidney. (D) Several erythrocytes were endocytosed (star) and degraded to some fragments (arrow)
by ECs. (E) The mitochondrial ultrastructure of renal vascular ECs from uremic rats showed cristae
reduced and content lost (arrow). (F–I) Kidney sections were stained with DAB-enhanced Prussian blue to detect iron deposits
on the microvasculature EC. Representative images of kidney sections from the uremia
group (F and G) and control (H and I) are shown. Panels (G) and (I) show the magnified
images of selected areas from (F) and (H), respectively. (J–O) Adenine-induced ferroptosis in the kidney of rats. (J) The iron content of the kidney
tissue was measured in each group. (K) The level of lipid peroxide MDA in each group.
(L) The level of H2O2 in each group. (M) The GSH level in each group. (N) The activity of SOD in each group.
(O)The activity of CAT in each group. All data are mean ± SD of at least three independent
experiments (n = 5 rats/group). (P) Western blotting of HO-1, FTN, FPN, GPX4, SLC7A11, and TMEM16F protein expression
of kidney tissue in control and uremic rats treated with or without 1% DMSO, 1 mg/kg
Fer-1, 25 mg/kg DFO, and 0.2 mg/kg AnV, respectively (n = 5 rats/group). Data are expressed as the mean ± SD of at least three independent
experiments. The relative density of protein bands was quantified and normalized to
β-actin. AnV, annexin V; CAT, catalase; DFO, deferoxamine; EC, endothelial cell; Fer-1,
Ferrostatin-1; FPN, ferroportin; FTN, ferritin; GPX4, glutathione peroxidase 4; GSH,
glutathione; H2O2, hydrogen peroxide; HE, hematoxylin-eosin; HO-1, heme oxygenase-1; MDA, malondialdehyde;
MSB, Martius Scarlet Blue; SD, standard deviation; SOD, superoxide dismutase.
Fig. 5 Erythrophagocytosis triggered ferroptosis of kidney in the uremic rats. Histological
analyses of the kidney tissue section in three different stainings (HE, MSB, and DAB-enhanced
Prussian blue). (A) Light microscopy image of a blood vessel showed internalization of multiple RBCs
by ECs (indicated by arrow). (B) Representative image of MSB staining showed RBC aggregates and fibrin on the microvasculature
EC surface in the uremic kidney. (C) Transmission electron microscopy image of an erythrocyte trapped and anchored by
EC in the vessel of the uremic kidney. (D) Several erythrocytes were endocytosed (star) and degraded to some fragments (arrow)
by ECs. (E) The mitochondrial ultrastructure of renal vascular ECs from uremic rats showed cristae
reduced and content lost (arrow). (F–I) Kidney sections were stained with DAB-enhanced Prussian blue to detect iron deposits
on the microvasculature EC. Representative images of kidney sections from the uremia
group (F and G) and control (H and I) are shown. Panels (G) and (I) show the magnified
images of selected areas from (F) and (H), respectively. (J–O) Adenine-induced ferroptosis in the kidney of rats. (J) The iron content of the kidney
tissue was measured in each group. (K) The level of lipid peroxide MDA in each group.
(L) The level of H2O2 in each group. (M) The GSH level in each group. (N) The activity of SOD in each group.
(O)The activity of CAT in each group. All data are mean ± SD of at least three independent
experiments (n = 5 rats/group). (P) Western blotting of HO-1, FTN, FPN, GPX4, SLC7A11, and TMEM16F protein expression
of kidney tissue in control and uremic rats treated with or without 1% DMSO, 1 mg/kg
Fer-1, 25 mg/kg DFO, and 0.2 mg/kg AnV, respectively (n = 5 rats/group). Data are expressed as the mean ± SD of at least three independent
experiments. The relative density of protein bands was quantified and normalized to
β-actin. AnV, annexin V; CAT, catalase; DFO, deferoxamine; EC, endothelial cell; Fer-1,
Ferrostatin-1; FPN, ferroportin; FTN, ferritin; GPX4, glutathione peroxidase 4; GSH,
glutathione; H2O2, hydrogen peroxide; HE, hematoxylin-eosin; HO-1, heme oxygenase-1; MDA, malondialdehyde;
MSB, Martius Scarlet Blue; SD, standard deviation; SOD, superoxide dismutase.
Then, iron metabolism and lipid peroxidation signaling were detected in kidney tissue.
Representative images of Perls blue plus diaminobenzidine staining revealed increased
reactive iron deposits on the microvasculature EC in the uremic kidney compared to
control, which further proved that iron overload was the most important mechanism
in erythrophagocytosis-triggered EC ferroptosis ([Fig. 5F–I]). Moreover, compared with the control group, the uremic rats had significantly higher
content of iron, MDA, and H2O2, as well as decreased GSH content, SOD, and CAT activity, all of which are also characteristic
markers of ferroptosis and indicate enhanced oxidative stress in the adenine-induced
uremic rat model ([Fig. 5J–O]). To further confirm the occurrence of ferroptosis following increased erythrophagocytosis
in vivo, adenine-treated rats were simultaneously treated with annexin V to block
the phagocytosis pathway, Fer-1 to inhibit ferroptosis, and DFO to chelate iron, respectively.
Next, we found that compared with the control group, the protein expression of HO-1,
responsible for heme breakdown, was significantly increased in uremic kidney tissue.
Consistent with increased HO-1 and iron, FTN responsible for storing excess iron also
increased in the uremic group. Both proteins were inhibited by Fer-1, DFO, and annexin
V, respectively. However, FPN, the only iron efflux channel located on the surface
of the cell membrane, was no different between the two groups. Additionally, the expression
levels of ferroptosis characteristic proteins GPX4 and SLC7A11 in uremic renal were
significantly lower than those in the corresponding control group and could be reversed
by Fer-1, DFO, and annexin V, which revealed that in addition to iron metabolism,
amino acid metabolism also involved in erythrophagocytosis-triggered ferroptosis in
our uremic model. We also detected the protein expression of TMEM16F that serves as
a phospholipid scramblase, consistent with the results in vitro, and TMEM16F increased
in the renal tissue of the adenine-treated rats but reduced in uremic rats treated
with Fer-1, DFO, and annexin V compared to the control group (i.e., nontreated) ([Fig. 5P]). These series of results confirmed that erythrophagocytosis-induced ferroptosis
indeed occurred in vivo, and both iron overload and lipid peroxidation contributed
to the pathological process.
Erythrophagocytosis-Induced Ferroptosis of ECs Promoted Hypercoagulability in Uremic
Rats
To confirm whether erythrophagocytosis-induced ferroptosis plays a role in uremia-associated
thrombogenesis, a flow restriction model was used. In response to the restriction
of venous blood flow, all (4 of 4) uremic rats developed a thrombus within 6 hours
after flow stasis in the IVC. And four control rats also formed a visible thrombus
after 6 hours of stasis ([Fig. 6A]). Moreover, weight, length, and the index of weight (mg)/length (mm) of the thrombus
in uremic group were all significantly higher than in the control group, suggesting
the thrombus was tighter and denser in uremic rats. However, treating adenine-fed
rats with Fer-1, DFO, or annexin V significantly reduced the parameters of thrombus
([Fig. 6B–D]). Next, the phosphatidylserine exposure of erythrocytes was analyzed by flow cytometry
and, as expected, the percentage of annexin V-positive erythrocytes significantly
increased in uremic rats (5.97 ± 0.49%) compared to healthy controls (1.22 ± 0.08%,
p < 0.001) ([Fig. 6E]). Thromboelastography was used in our study to further monitor dynamic real-time
pictures of coagulation in rats. There was a significant difference between uremic
rats and control rats, with uremic rats having a shorter R time, and larger α angle,
maximum amplitude (MA), and clotting index (CI). Not surprisingly, with the addition
of Fer-1, DFO, and annexin V in uremic rats, the R time was markedly prolonged, while
α angle, MA, and CI were reduced compared to rats only treated with adenine ([Fig. 6F–J]), which further proved the contribution of ferroptosis in blood hypercoagulability
of uremic rats. Taken together, these results confirmed that erythrophagocytosis-induced
EC ferroptosis accompanying phosphatidylserine exposure led to a prothrombotic state
and local thrombus formation (Visual Summary).
 Fig. 6 Erythrophagocytosis-induced ferroptosis contributed to hypercoagulability in uremic
rats. IVC was ligated to obtain complete blood stasis in rats. After 6 hours of flow
restriction, rats (n = 4 per group) were euthanized and the IVC-containing thrombi were harvested. (A) Representative images of thrombus from control and uremic rats treated with or without
Fer-1, DFO, and AnV. The weight (B), length (C), and weight/length ratio (D) of the thrombus in each group of rats are shown. (E) RBCs from control and uremic rats were stained with annexin V–FITC and analyzed
by flow cytometry. Data were expressed as the mean ± SD of four independent experiments.
The entire hemostatic system was monitored by thromboelastography. An amount of 1 mL
of citrated whole blood was drawn (blood:citrate [sodium citrate 3.8%]; 8:2) from
each group of rats (n = 4) via cardiac puncture and mixed with 40 μL kaolin. 340 μL citrated blood was
mixed with 20 μL CaCl2 (0.2 M) for thromboelastography analysis. (F) Various representative thromboelastography traces showed a real-time and dynamic
picture of coagulation in each group. Major coagulation parameters were analyzed including
R time (G), α angle (H), MA (I), and CI (J). Results were mean ± SD (n = 4 rats/group). α angle, alpha angle; AnV, annexin V; CI, clotting index; DFO, deferoxamine;
Fer-1, ferrostatin-1; IVC, inferior vena cava; MA, maximum amplitude; R time, reaction
time; SD, standard deviation.
Fig. 6 Erythrophagocytosis-induced ferroptosis contributed to hypercoagulability in uremic
rats. IVC was ligated to obtain complete blood stasis in rats. After 6 hours of flow
restriction, rats (n = 4 per group) were euthanized and the IVC-containing thrombi were harvested. (A) Representative images of thrombus from control and uremic rats treated with or without
Fer-1, DFO, and AnV. The weight (B), length (C), and weight/length ratio (D) of the thrombus in each group of rats are shown. (E) RBCs from control and uremic rats were stained with annexin V–FITC and analyzed
by flow cytometry. Data were expressed as the mean ± SD of four independent experiments.
The entire hemostatic system was monitored by thromboelastography. An amount of 1 mL
of citrated whole blood was drawn (blood:citrate [sodium citrate 3.8%]; 8:2) from
each group of rats (n = 4) via cardiac puncture and mixed with 40 μL kaolin. 340 μL citrated blood was
mixed with 20 μL CaCl2 (0.2 M) for thromboelastography analysis. (F) Various representative thromboelastography traces showed a real-time and dynamic
picture of coagulation in each group. Major coagulation parameters were analyzed including
R time (G), α angle (H), MA (I), and CI (J). Results were mean ± SD (n = 4 rats/group). α angle, alpha angle; AnV, annexin V; CI, clotting index; DFO, deferoxamine;
Fer-1, ferrostatin-1; IVC, inferior vena cava; MA, maximum amplitude; R time, reaction
time; SD, standard deviation.
Discussion
Uremia might be at high risk of cardiovascular and thrombotic events that require
special attention.[28] A better understanding of the prothrombotic mechanisms of uremic toxins could help
to find novel therapeutic targets to prevent thrombosis in uremia. In this study,
to investigate the role of uremic toxin exposure on RBC and its effect on EC function,
we set up an in vitro co-incubation model of uremic RBC and EC that may mimic uremic
condition and an adenine-induced chronic kidney disease rat model. We first found
that uremic solute IAA-treated phosphatidylserine-exposed erythrocytes were sequestered,
endocytosed, and degraded by EC in vitro. Then, increased erythrophagocytosis triggered
EC ferroptosis and induced a procoagulant phenotype on EC through increased phosphatidylserine
exposure that is mediated by TMEM16F. Furthermore, thromboelastography and IVC ligation-induced
flow stasis model confirmed that uremic rats exhibited the hypercoagulable state and
were more prone to develop VTE, which was related to erythrophagocytosis-induced ferroptosis.
More importantly, we demonstrated that iron overload and perturbations of amino acid
metabolism were the most important mechanism of erythrophagocytosis-triggered EC ferroptosis.
It is well known that the ageing RBCs are mainly cleared by macrophage, named erythrophagocytosis.[29] Professional phagocytes such as macrophages and dendritic cells are the main phagocytes,
which have the capacity to remove dead cells and other foreign materials in the body.[30] However, professional macrophages may become overwhelmed by the excessive amounts
of eryptotic or damaged RBCs in uremia, the amateur phagocytes which can also participate
in efferocytosis when needed. Amateur phagocytes are nonmyeloid progenitor/nonimmune
cells that include differentiated cells (e.g., epithelial cells, fibroblasts, and
ECs) and stem cells.[31] ECs as amateur phagocytes which exist in a large amount on the walls of blood vessels
represent the first barrier in contact with erythrocytes and have the potential phagocytotic
ability.[32] Ageing or damaged RBCs express phosphatidylserine on their surface which can directly
bind to Stabilin-2 or Tim-4 on the macrophage or via opsonins such as Gas-6, lactadherin,
or thrombospondin-1.[33] The ability of uremic plasma to promote erythrophagocytosis may be associated with
the proinflammatory state, enhanced oxidative stress, and the accumulation of toxins.[34]
[35] Moreover, increased erythrophagocytosis could accompany by decreased levels of CD47,
a do not eat me signal.[36] Our previous studies demonstrated that ECs could endocytose activated platelets,
apoptotic neutrophils, and acute promyelocytic leukemia cells.[24]
[37]
[38] Catan et al reported that vECs were able to bind and internalize aged/glycated RBC
in diabetic conditions and may promote vulnerable atherothrombotic plaques to rupture.[39] However, the effects on ECs' biology of progressively ingesting large numbers of
RBCs are not completely understood; moreover, the relationship between erythrophagocytosis
and procoagulant activity of ECs in uremia has not been explored. In our RBC treatment
model, we found that ECs engulfed large amounts of phosphatidylserine-exposed IAA-induced
erythrocytes even with no bridge molecules, and exhibited morphologic abnormal mitochondria,
increased ROS and lipid peroxidation, all of which were all reduced by treatment with
Fer-1 or DFO, indicating ECs undergo ferroptosis following enhanced erythrophagocytosis
in the uremic environment. Our previous studies have reported that uremic toxins such
as uric acid, IAA, and IS could significantly increase phosphatidylserine exposure
of RBCs.[11]
[40] In the present study, we chose one of the uremic toxins IAA, and we suggested that
other uremic toxins including urea, creatinine, oxalic acid, uric acid, and IS also
play a similar role in erythrophagocytosis-triggered ferroptosis of EC and followed
procoagulant activity. The effect of other toxins on this process will be detected
in the future.
We then sought to explore the mechanisms of erythrophagocytosis-induced ferroptosis
in EC. As a complex form of cell death, ferroptosis mainly involves three biochemical
metabolisms, including iron, amino acid, and lipid metabolism.[41] We hypothesized iron disorder may be the most important reason because plenty of
hemoglobin was degraded in the EC after phagocytosis of RBCs. Usually, macrophages
play important physiological roles in iron metabolism and recycling by increasing
the expression of HO-1 and FTN to handle the increased heme and iron load, thus keeping
homeostatically and protecting it from severe oxidative stress.[42] However, the biological role of iron metabolism in erythrophagocytosis-induced EC
ferroptosis remains poorly understood. In the present study, we systematically studied
the protein expression in the pathway of iron metabolism of ECs following clearance
of RBCs. We found an increased accumulation of free iron and FTN in EC incubated with
I-RBCs, while the FPN responsible for iron efflux was no different. Moreover, treatment
of ECs with Fer-1 did not decrease the LIP and the content of FTN, whereas they were
both reduced after treatment with the iron chelator DFO. Therefore, we speculated
that iron overload in ECs eventually leads to ferroptosis. We further investigated
several molecules in iron and redox metabolism that have been implicated in ferroptosis.
Although HO-1 was thought to be a protective antioxidant enzyme, growing data suggest
it plays a positive role in ferroptosis.[43] Recent studies have demonstrated that HO-1 drives ferroptosis by promoting iron
overload in cardiomyopathy, hemochromatosis, and β-thalassemia.[44]
[45]
[46] Consistent with most others' reports, HO-1 protein expression was enhanced in our
model, which catalyzes heme degradation and facilitates the release of free iron.
We speculate that the upregulated HO-1 in our erythrophagocytosis-induced EC model
was mainly attributed to the regulation of the Nrf2 signaling pathway. Whether HO-1
is expressed in mature erythrocytes remains unclear, which needs to be investigated
in our future study. Beside the iron metabolism, we also explored the key protein
in amino acid metabolism pathway. SLC7A11 is a cystine/glutamate antiporter that mediates
the efflux of cellular glutamate and the influx of cystine, which plays a role in
ferroptosis due to regulation of the downstream synthesis of GPX4 and then catalyzed
the reaction between GSH and lipid peroxides and prevent ferroptosis.[47]
[48] In our present cell model, erythrophagocytosis reduced the protein expression of
SLC7A11 and GPX4, which may further facilitate the accumulation of lipid peroxide
and contribute ferroptosis of EC. In an adenine-induced uremic rat model, we observed
that RBCs showed specific binding and internalization by vECs in the kidney, and we
considered that this could evoke serious damage to the vEC, and similarly to that
observed in vitro, we noted erythrophagocytosis-induced mitochondrial damage. At the
same time, we found that the contents of Fe3+, the lipid peroxide MDA, and H2O2 were increased in the kidney, while GSH, CAT, and SOD activities were decreased,
all of which are characteristic indicators of ferroptosis.[49] Furthermore, the protein expression changes of FTN, FPN, HO-1, GPX4, SLC7A11, and
TMEM16F in uremic rats were consistent with our in vitro experiments and could be
reversed by blocking the phagocytic pathway or inhibition of ferroptosis. However,
there is still a trend of increased thrombus size even with Fer-1 or DFO treatment
in uremia condition, and we think that phosphatidylserine-exposed RBC/platelets/myeloid
cells may involve in thrombogenesis in uremia, which has been demonstrated in our
previous studies.[10]
[11] Combined, in the erythrophagocytosis model that mimics a uremic environment and
the uremic rat model, we revealed that increased heme upregulated the expression of
HO-1, which promoted the release of free iron, thus increasing a variety of ROS and
lipid peroxidation products through Fenton reaction and driving ferroptosis. Several
ferroptosis-associated proteins including SLC7A11 and GPX4 also involved in this process.
Further studies may need to elucidate the relationship of regulating mechanism between
iron, GSH, and lipid metabolism in our model.
The relationship between EC dysfunction and subsequent thrombotic events is already
well known in cardiovascular diseases, diabetes, and uremia.[50]
[51] Here, we are especially concerned about the significant involvement of the EC ferroptosis
in the thrombotic complication of uremia. We found that the erythrophagocytosis led
to the increase of phosphatidylserine externalization on the surface of ECs, which
provided binding sites for clotting factors FXa and prothrombinase complexes, thus
promoting the coagulation cascade reaction and subsequently leading to a dramatic
increase in thrombin generation. By lactadherin inhibition assay, we further demonstrated
that the increase in phosphatidylserine externalization after ferroptosis was the
main reason for the enhancement of procoagulant activity in EC. TMEM16F is a Ca2+-activated phospholipid scramblase located on the cell membrane, which moves phospholipids
from the inner to the outer leaflet of the plasma membrane.[25]
[40] Recently, pieces of evidence have been provided that TMEM16F participates in cell
apoptosis, ferroptosis, and pyroptosis.[52]
[53]
[54] We found increased TMEM16F expression in renal tissue of uremic rats and EC undergoing
ferroptosis, which may explain the reason why phosphatidylserine externalization increased
following ferroptosis in our model. In line with earlier reports describing that adenine-treated
rats induce an increased thrombogenicity,[55] we found an adenine-induced uremic rat model exhibited enhanced thrombotic tendency
by thromboelastography and IVC model. Additional pretreatment with Fer-1 to inhibit
ferroptosis or annexin V to block the pathway of phagocytosis significantly decreased
the hypercoagulability and ameliorated the flow restriction-induced venous thrombi
in uremic rats, which demonstrated erythrophagocytosis-induced ferroptosis played
a critical role in the high tendency of uremic thrombus formation, confirming our
in vitro findings. Taken together, our present study not only indicated erythrophagocytosis-induced
ferroptosis in EC, but also confirmed that TMEM16F-mediated phosphatidylserine exposure
during the process of ferroptosis plays a major role in uremia-associated thrombosis.
Additional studies are required to establish an in vivo experiment to inhibit the
phagocytosis of macrophages, and to further determine the phagocytosis of RBCs and
other peripheral blood cells or microparticles by ECs.
In conclusion, our findings suggest uremic RBC could trigger EC phagocytosis, ferroptosis,
and thrombogenesis, which may be clinically relevant to the complication of uremia,
such as anemia, infection, and thrombosis. Alternatively, inhibition of erythrophagocytosis
or ferroptosis could be a novel therapeutic strategy to alleviate the thromboembolic
complication of uremia.
What is known about this topic?
-
Uremia might be at high risk of cardiovascular and thrombotic events; however, its
mechanism is largely unknown.
-
ECs as amateur phagocytes have phagocytic properties for lactadherin-opsonized RBC.
-
The role of ferroptosis in the occurrence and development of thrombosis remains largely
unclear.
What does this paper add?
-
Uremic RBC could trigger EC phagocytosis, ferroptosis, and thrombogenesis; TMEM16F-regulated
PS exposure plays a key role in this process.
-
Iron and amino acid metabolisms were involved in EP-triggered ferroptosis, which may
be promising targets to prevent thrombosis of uremia.


