

Subscribe to RSS
DOI: 10.1055/a-2802-3514
Association of Fibrin Clot Characteristics with Development of Ischemic Stroke in Patients with Recently Diagnosed Type 2 Diabetes
Authors
Funding Information This work was supported by a grant from Steno Diabetes Center Odense (funded by the Novo Nordisk Foundation), Region Syddanmark, and Karola Jørgensens Research Foundation. The funding sources were not involved in the study.

Abstract
Background
Ischemic stroke occurs when a thrombus blocks a cerebral artery, and an important component is the fibrin clot. Different plasma fibrinogen variants have been associated with stroke risk in type 2 diabetes (T2D). We hypothesized that in vitro fibrin clot characteristics are associated with stroke risk and correlate with fibrinogen variants.
Objective
To investigate the association of fibrin clot characteristics with risk of ischemic stroke in T2D and the correlation of fibrinogen variants with clot characteristics.
Methods
In a nested case-control study with a median follow-up of 4.1 years, we included 144 T2D patients with ischemic stroke (cases) and 144 matched T2D patients without ischemic stroke (controls). Clot formation (velocity [V max], maximum absorbance [MA], overall hemostasis potential [OHP]), lysis, and structure (fiber density, diameter) were analyzed by turbidimetry. Clot characteristics were compared between cases and controls using a Mann–Whitney test and associated with stroke risk using conditional logistic regression to determine associations with stroke risk. Spearman's rank correlation was used to determine correlations between clot characteristics and fibrinogen variants (fibrinogen α E, fibrinogen γ′, and sialylated fibrinogen).
Results
Fibrin fiber density at baseline was significantly lower in future stroke cases (4.2 [3.7–4.7] ×1022 Da/cm3) than in controls (4.5 [4.0–4.9] ×1022 Da/cm3), p: 0.01. Moreover, patients in the highest versus lowest tertile of fiber density had an adjusted OR for ischemic stroke of 0.7 (95% CI: 0.3–1.5). Patients with higher V max, MA, OHP, and fiber diameter all had ischemic stroke ORs around 1.5, yet the limited statistical precision of the estimates hampered firm conclusions. Absolute, but not relative, levels of fibrinogen variants correlated with clot characteristics.
Conclusion
In our study, turbidimetric fibrin clot characteristics were not convincingly associated with ischemic stroke in T2D. Absolute levels of fibrinogen variants correlated consistently with clot characteristics.
Introduction
Type 2 diabetes (T2D) affects 6.3% of the world's population,[1] and these patients have a 40% higher risk of ischemic stroke than healthy individuals.[2] Patients who survive ischemic stroke are often left disabled and have an increased risk of stroke recurrence.[3] Several environmental and genetic risk factors for stroke are known.[4] However, not much is known about triggers for ischemic stroke in T2D patients, and identifying these triggers will provide biomarkers that will be valuable tools for predicting stroke development.
Ischemic stroke occurs when a thrombus blocks a cerebral artery. Ischemic stroke can be either transient or permanent, and the thrombus can be formed in the brain itself (thrombotic stroke) or carried to the brain from elsewhere in the body (thromboembolic stroke).[5] An important component of the thrombus is the fibrin network. Its formation involves the conversion of fibrinogen into fibrin when thrombin cleaves off fibrinopeptides A and B. The exposed “knobs” on the fibrin monomer interact with “holes” on another fibrin monomer, creating oligomers. These lengthen to protofibrils, which aggregate and create fibrin fibers in a three-dimensional fibrin network that stabilizes the thrombus.[6] The thrombus is later digested by plasmin in the fibrinolysis process, which will restore blood flow.[7]
The potential of fibrinogen to form a fibrin clot can be measured in vitro by adding thrombin to a plasma sample, and in this analysis, fibrin fiber polymerization, clot structure, and clot lysis characterize the fibrin clot. These fibrin clot characteristics are interesting biomarkers in the understanding of the development of ischemic stroke and T2D.[8] [9] [10] Clots from patients with acute ischemic stroke were reported as denser, less porous, with thicker fibers, and with prolonged lysis times compared with clots from healthy controls.[11] [12] Fibrin clots from T2D patients show more branching, higher density, and reduced permeability compared to clots from healthy controls.[13] [14] Fibrin polymerization velocity was also reduced in plasma from T2D patients compared to that in nondiabetic subjects.[15] Plasma studies have shown that clot permeability and lysis rate were improved by glycemic control and decreased fibrinogen glycation.[16] Both well-controlled and poorly controlled diabetes patients had elevated glycation of fibrinogen,[17] and it has been speculated that this glycation causes changes in the fibrin network structure. It is also reported that both plasma with glycated fibrinogen and in vitro glycation of fibrinogen show reduced rates of fibrin polymerization compared to normal fibrinogen.[15]
It is well known that the concentration of total fibrinogen determines fibrin clot characteristics,[18] [19] but also the isoforms fibrinogen α E,[20] fibrinogen γ′,[21] and sialylated fibrinogen[22] [23] [24] [25] have been associated with properties of the fibrin network in purified systems. We have shown that fibrinogen and these three fibrinogen variants were associated with the development of ischemic stroke in T2D.[26] We therefore hypothesized that fibrin clot characteristics are associated with the risk of ischemic stroke in recently diagnosed T2D patients, and that the three fibrinogen variants correlate with measures of clot characteristics in T2D patients. We investigated this in a case-control study nested in a large prospective cohort study of patients with recently diagnosed T2D that we followed with respect to the development of ischemic stroke.
Materials and Methods
Ethics
The Regional Ethics Committee in the Region of Southern Denmark approved the project (project ID S-20200028), and a data processing agreement (13/11,544) was accepted by DD2 and University Hospital of Southern Denmark, Esbjerg. Informed consent was signed by the study participant at DD2 enrollment.
Study Design and Participants
Stroke Cases and Controls Within a Diabetes Cohort
The study is described in detail elsewhere.[26] In brief, the design is a nested case-control study using data from the Danish Centre for Strategic Research in Type 2 Diabetes (DD2). DD2 is an ongoing nationwide cohort, including patients recently diagnosed with T2D. At enrollment in DD2, baseline data and plasma samples are collected.[27] [28] Patients in this nested case-control study were enrolled in DD2 from 2010 to 2017 and were followed prospectively through different registries[29] for a median of 4.1 years (25–75 percentile 2.7–5.1) with respect to the development of ischemic stroke. Stroke patients were recently diagnosed with T2D and excluded if they more than 4 years before DD2 enrollment: were diagnosed with T2D, had redeemed a glucose-lowering drug, or had been enrolled in the Danish Diabetes Database for Adults (DDDA) database. They were also excluded from the study if they had cancer or atrial fibrillation (AF) less than 1 year before enrollment, or were treated with anticoagulants less than 100 days before DD2 enrollment. Each DD2 stroke case was matched with a DD2 diabetes control with no history of stroke. Matching was performed on the date of the first stroke (index date), based on age (±1 year), sex, and date of DD2 enrollment (±1 year). The diabetes control had to be alive and enrolled in the DD2 database on the index date. In total, 153 first-ever ischemic stroke patients and 153 matching diabetes controls were eligible for baseline plasma analysis. Due to lack of citrate plasma in nine of the study subjects, 144 complete matched pairs of stroke cases and diabetes controls were available for analysis in the present study ([Fig. 1]).

[Table 1] presents previously published characteristics of T2D patients and levels of total fibrinogen and three fibrinogen variants (fibrinogen α E, fibrinogen γ′, and sialylated fibrinogen) measured at DD2 enrollment.[26] Results relevant for the present study show that baseline hemoglobin A1c (HbA1c), waist-hip ratio (WHR), and presence of microvascular complications were higher among stroke cases than diabetes controls. Stroke cases were more physically inactive, and more cases were smokers and had prior cardiovascular disease (CVD) comorbidity, although not statistically significant from the diabetes controls. Levels of total fibrinogen and fibrinogen variants were higher in stroke cases than in diabetes controls, but the ratio between each of the fibrinogen variants and total fibrinogen (relative level) did not differ between cases and controls.
|
Variables |
Cases (n = 144) |
Controls (n = 144) |
p-Value |
|---|---|---|---|
|
Age at DD2 enrollment (y) |
66.0 (60.0–73.0) |
66.5 (60.0–73.0) |
0.99 |
|
Time from diabetes to DD2 enrollment (mo) |
11.0 (3.0–25.5) |
8.0 (2.0–22.0) |
0.12 |
|
Sex (female) |
63 (43.8) |
63 (43.8) |
1.00 |
|
WHR (women/men) |
<0.001 |
||
|
Low: ≤0.80 ≤ 0.95 cm |
16 (11.1) |
18 (12.5) |
|
|
Moderate: 0.81–0.85/0.96–1.00 cm |
14 (9.7) |
39 (27.1) |
|
|
High: >0.85 > 1.00 cm |
114 (79.2) |
87 (60.4) |
|
|
30.1 (26.2–33.8) |
29.7 (26.3–33.9) |
0.95 |
|
|
Alcohol intake (women/men) |
1.00 |
||
|
<14 units/21 units weekly |
133 (92.4) |
133 (92.4) |
|
|
>14 units/21 units weekly |
11 (7.6) |
11 (7.6) |
|
|
Physical activity in the year prior to enrollment |
0.14 |
||
|
Mainly sedentary |
22 (15.3) |
16 (11.1) |
|
|
Light exercise at least 4 h/wk |
97 (67.4) |
90 (62.5) |
|
|
Moderate/heavy exercise at least 4 h/wk |
25 (17.4) |
38 (26.4) |
|
|
0.33 |
|||
|
Smokes daily/occasionally |
25 (22.7) |
15 (15.2) |
|
|
Ex-smoker |
41 (37.3) |
37 (37.4) |
|
|
Never smoked |
44 (40.0) |
47 (47.5) |
|
|
6.6 (6.2–7.2) |
6.4 (6.0–6.8) |
0.03 |
|
|
7.1 (6.5–8.3) |
7.3 (6.7–8.1) |
0.50 |
|
|
High BP (systolic > 140 or diastolic > 90 mmHg) |
0.49 |
||
|
No |
70 (60.9) |
68 (65.4) |
|
|
CRP (mg/L) |
2.3 (1.0–4.8) |
1.9 (0.7–3.4) |
0.04 |
|
Total cholesterol[c] (mmol/L) |
4.4 (3.9–5.3) |
4.7 (3.6–5.6) |
0.49 |
|
LDL cholesterol[c] (mmol/L) |
2.3 (1.7–2.8) |
2.1 (1.6–2.8) |
0.54 |
|
HDL cholesterol[c] (mmol/L) |
1.3 (1.0–1.6) |
1.3 (1.0–1.5) |
0.74 |
|
Triglycerides[c] (mmol/L) |
1.7 (1.2–2.2) |
1.5 (1.1–2.2) |
0.45 |
|
Antidiabetic drugs |
123 (85.4) |
114 (79.2) |
0.16 |
|
Insulin |
8 (5.6) |
7 (4.9) |
0.79 |
|
Metformin |
121 (84.0) |
112 (77.8) |
0.18 |
|
Lipid-lowering drugs |
106 (73.6) |
105 (72.9) |
0.89 |
|
Statins |
106 (73.6) |
105 (72.9) |
0.89 |
|
Acetylsalicylic acid |
53 (36.8) |
58 (40.3) |
0.54 |
|
NSAIDs |
109 (75.7) |
109 (75.7) |
1.00 |
|
Any CVD (IHD, atherosclerosis, HF, or VTE) |
42 (29.2) |
31 (21.5) |
0.14 |
|
Microvascular complications |
29 (20.1) |
13 (9.0) |
<0.01 |
|
Total fibrinogen (g/L) |
3.55 (3.13–4.14) |
3.44 (2.90–3.90) |
0.04 |
|
Fibrinogen α E (µg/mL) |
8.95 (7.65–11.15) |
8.55 (6.90–10.65) |
0.06 |
|
Fibrinogen α E (% of total) |
0.26 (0.22–0.31) |
0.25 (0.21–0.29) |
0.63 |
|
Fibrinogen γ′ (µg/mL) |
638 (556–768) |
626 (480–764) |
0.27 |
|
Fibrinogen γ′ (% of total) |
18.0 (15.6–20.7) |
18.1 (15.2–20.3) |
0.87 |
|
Sialylated fibrinogen (AU) |
1.32 (1.16–1.50) |
1.18 (1.06–1.45) |
<0.01 |
|
Sialylated fibrinogen (AU/[g/L]) |
0.37 (0.34–0.40) |
0.36 (0.33–0.39) |
0.22 |
Abbreviations: AU, arbitrary unit; BMI, body mass index; BP, blood pressure; CRP, C-reactive protein; CVD, cardiovascular disease; DD2, Danish Centre for Strategic Research in type 2 diabetes; HbA1c, hemoglobin A1c; HDL, high-density lipoprotein; HF, congestive heart failure; IHD, ischemic heart disease; atherosclerosis as diagnosed with ICD-code-I70; LDL, low-density lipoprotein; NSAIDs, nonsteroidal anti-inflammatory drugs; T2D, type 2 diabetes; VTE, venous thromboembolism; WHR, waist-hip ratio.
Note: Data are presented as median (25–75 percentiles) or counts (percentages). Baseline characteristics and fibrinogen levels were previously reported in Daugaard et al.[26]
a For cases only available in 65% (blood glucose), 86% (BMI), 72% (smoking), and 76% (HbA1c).
b For diabetes controls, only available in 68% (blood glucose), 88% (BMI), 65% (smoking), and 69% (HbA1c).
c Measurements available for n = 65 to 112.
Blood Sampling
Blood samples were collected from DD2 participants at their clinical enrollment visit, in the fasting state, and before intake of any medication. Venous blood was drawn in two 2.7 mL trisodium citrate tubes (0.109 M Na3-citrate) and centrifuged for 10 minutes at room temperature at 1,500 to 2,000 × g within 2 hours after collection. Plasma was aliquoted and mailed overnight at ambient temperature to a central biobank, where the samples were stored at −80°C until analysis.[28]
Fibrin Clot Characteristics
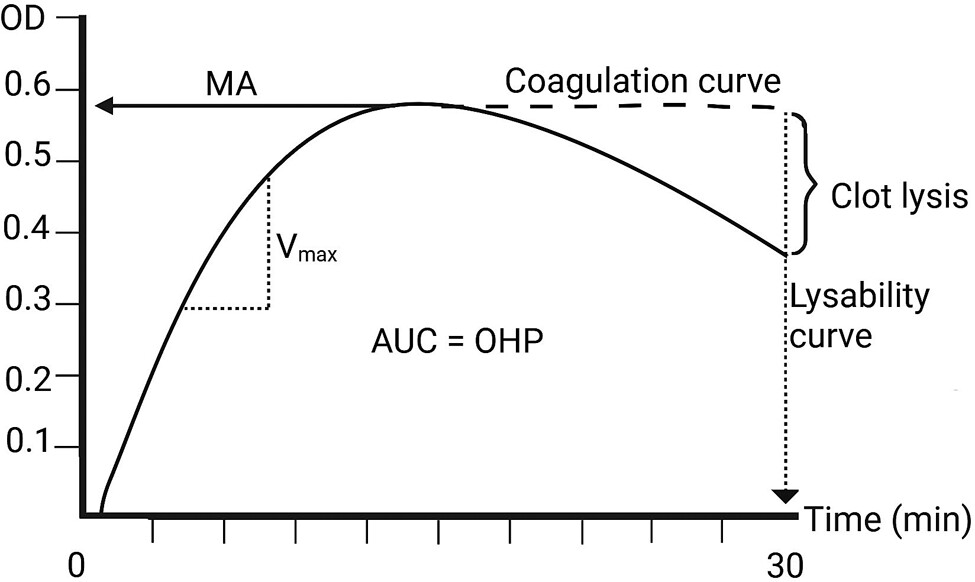
The formation of plasma fibrin clots was analyzed in vitro by turbidity measurements as described by Sjøland et al, with slight modifications.[8] In brief, plasma was mixed with thrombin (1.0 IU/mL) and CaCl2 (15 mmol/L; final concentrations) in a 96-well microplate (Thermo Fisher Scientific, Roskilde, Denmark) in order to initiate fibrin polymerization. At the same time, in different wells, tissue-type plasminogen activator (tPA; 300 ng/mL, final concentration) was added to initiate internal lysis. Fibrin clot formation and lysability were determined using turbidity-based methods, measuring optical density (OD) at 340 nm every 15 seconds for 30 minutes at 25°C on a Sunrise absorbance microplate reader (Tecan Group Ltd., Männedorf, Switzerland). A clot-lysis curve was created from which the following variables were obtained ([Fig. 2]): slope of the steepest part of the curve (V max, reflects velocity of protofibril aggregation),[30] maximum absorbance as the difference between the highest point on the lysis curve and absorbance value at time = 0 (MA, reflects peak fibrin concentration),[31] percentage of clot breakdown after 30 minutes (clot lysis, reflects the activity of fibrinolysis and refers to the reduction in OD relative to that of a clot produced without tPA). Finally, overall hemostasis potential (OHP) reflects the balance between fibrin generation and degradation.[32] OHP is calculated by the trapezoid method as the area under the lysis curve.
The microplate was sealed and stored overnight at 25°C. To investigate fibrin clot structure, OD was read at 340, 405, 540, 608, and 690 nm, and fiber mass density and fiber diameter were calculated according to Carr et al.[9] [10] Previous testing in our laboratory showed that 4 hours and overnight incubation resulted in clots with similar fiber diameter and density, and overnight incubation was chosen for logistical reasons. Inter-assay coefficients of variation of the clot-lysis variables were 12% for V max, 3% for MA, 15% for clot lysis, and 7% for OHP, fiber diameter, and fiber density.
Other Measurements
Methods and registries for the determination of previously reported enrollment characteristics, including total fibrinogen and fibrinogen variants (fibrinogen α E, fibrinogen γ′, and sialylated fibrinogen; [Table 1]), are described elsewhere.[26]
Statistics
Baseline fibrin clot characteristics in stroke cases (n = 144) and matched diabetes controls (n = 144) are presented as medians (25–75 percentiles) and were compared with a Mann–Whitney test. For each clot characteristic of interest (V max, MA, clot lysis, OHP, diameter, and density), subjects were divided into tertiles of that clot characteristic in the diabetes controls, and conditional logistic regression was used to estimate crude and adjusted odds ratio (OR) of stroke risk for study subjects with exposure values in the middle and upper tertile, relative to study subject with exposure values in the lower tertile. Based on a directed acyclic graph,[26] results were adjusted for the potential confounders smoking, high blood pressure, CVD, WHR, HbA1c, physical activity, and alcohol consumption. Lipids and CRP were considered mediators, that is, factors that could be part of the mechanisms linking fibrin clot characteristics to stroke, and were therefore not included as confounders. Microvascular complications were not considered a confounder, since they are not a causal risk factor for stroke. Furthermore, microvascular complications are strongly driven by HbA1c and overweight, which were both included as confounders. Statistical Analysis System 9.4 was used for all analyses of baseline characteristics and ORs. Missing data were addressed by including a subcategory “unknown” in the analyses.
Correlations between fibrinogen variants (fibrinogen α E, fibrinogen γ′, and sialylated fibrinogen) and fibrin clot characteristics (V max, MA, clot lysis, OHP, diameter, and density) in stroke cases and diabetes controls were assessed using Spearman's rank correlation coefficient (r S) due to predominantly nonnormally distributed variables. GraphPad Prism version 10.2.3 (GraphPad Software) was used, and p < 0.05 was considered statistically significant.
Results
Fibrin Clot Characteristics at Enrollment
The fibrin fiber density in clots made from plasma of stroke cases was significantly lower than in diabetes controls (4.2 [3.7–4.7] vs. 4.5 [4.0–4.9] × 1022 Da/cm3, p-value: 0.01). The remaining clot variables were comparable between the two groups ([Fig. 3]).

Fibrin Clot Characteristics and Stroke Risk
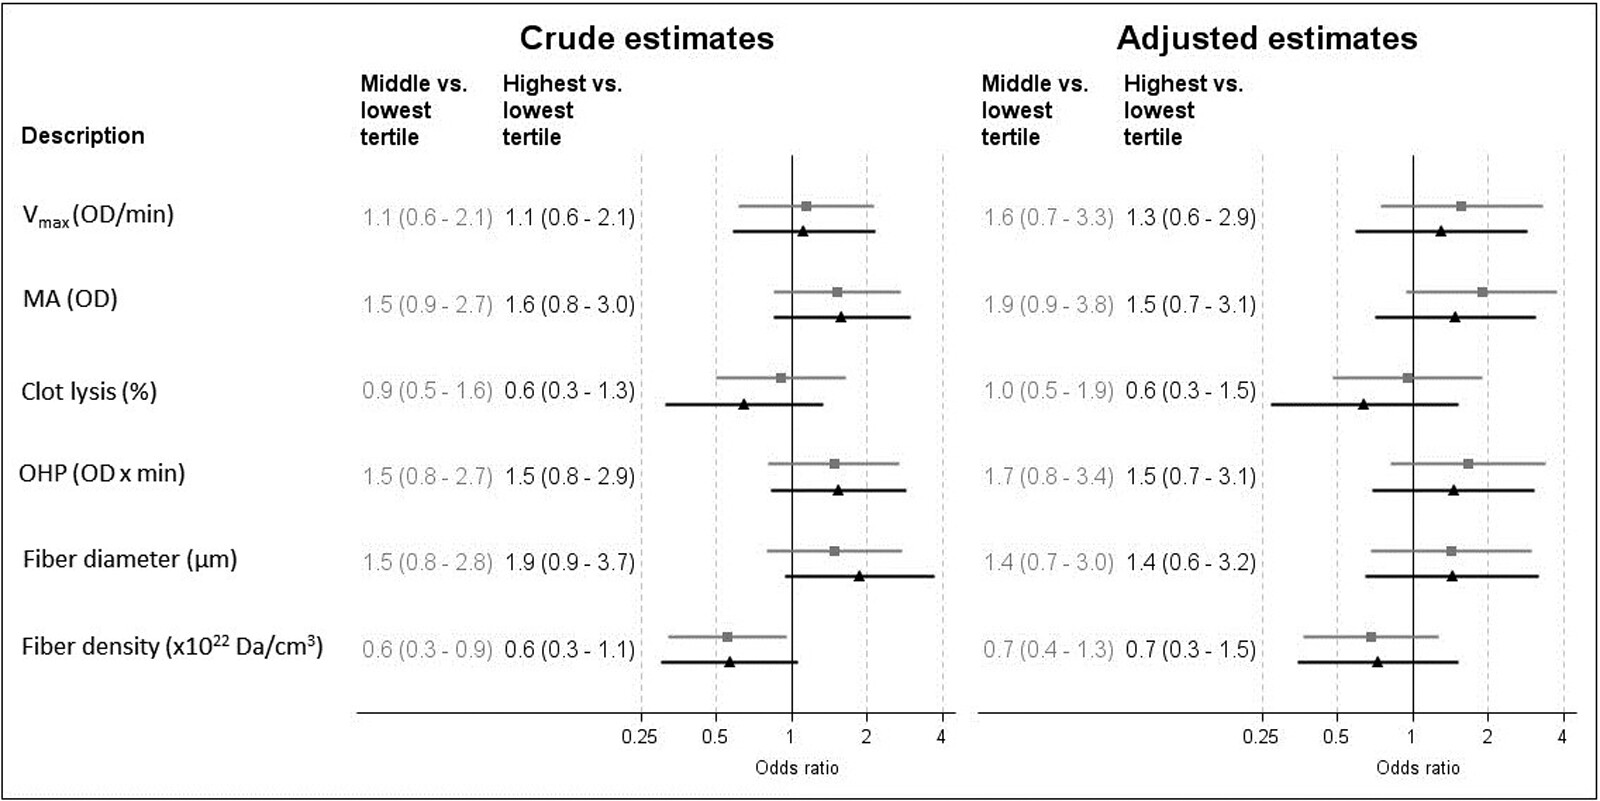
[Fig. 4] presents the ORs of ischemic stroke risk for T2D patients based on tertiles of clot characteristics. Overall, 95% CIs for the observed crude and adjusted ORs were relatively broad and most often included 1.0, denoting limited precision of risk estimates and association results that only reflected tendencies. Adjusted ORs showed that V max, MA, OHP, and fiber diameter were associated with a tendency of increased stroke risk in both the middle and highest tertiles, with ORs of 1.6 (95% CI: 0.7–3.3) and 1.3 (0.6–2.9) for V max and higher yet imprecise ORs of 1.9 (0.9–3.8) and 1.5 (0.7–3.1) for MA, 1.7 (0.8–3.4) and 1.5 (0.7–3.1) for OHP, and 1.4 (0.7–3.0) and 1.4 (0.6–3.2) for fiber diameter. Adjusted ORs for fiber density and clot lysis were associated with a tendency toward reduced stroke risk in both the middle and highest tertiles, with ORs of 0.7 (0.4–1.3) and 0.7 (0.3–1.5) for fiber density and 1.0 (0.5–1.9) and 0.6 (0.3–1.5) for clot lysis. Crude and adjusted estimates did not differ much ([Fig. 4]).
Correlations Between Fibrinogen Variants and Fibrin Clot Characteristics
Overall, we observed moderate to strong consistent correlations of fibrinogen and absolute levels of fibrinogen variants with fibrin clot characteristics in stroke cases and diabetes controls, while relative levels of fibrinogen variants did not correlate with clot characteristics ([Supplementary Table S1]).
There were positive correlations of fibrinogen and absolute levels of sialylated fibrinogen with MA, V max, OHP, and diameter, and negative correlations with clot lysis and density in both study groups. The correlations of absolute levels of fibrinogen γ′ and fibrinogen α E with fibrin clot characteristics showed the same pattern, although less strong with lower r S values, and were stronger in stroke cases and diabetes controls than in blood donors for MA, OHP, diameter, and density.
The correlations between MA and absolute and relative levels of the three fibrinogen variants are visualized in [Fig. 5] as an example.

Discussion
This nested case-control study included patients with newly diagnosed T2D, followed prospectively for stroke development. Baseline fibrin clot characteristics were compared between 144 pairs of diabetes patients with stroke and their matched controls without stroke, and the OR was used to describe the relationship with risk of ischemic stroke. Correlations between fibrinogen variants and fibrin clot characteristics were also investigated. Our main results are that baseline fiber density was lower in stroke cases than in diabetes controls and tended to be negatively associated with risk of stroke development. V max, MA, OHP, and fiber diameter at baseline tended to be positively associated with the risk of developing ischemic stroke in T2D patients. We observed a consistent association between absolute, but not relative, levels of fibrinogen variants and clot properties.
As reported in the literature, fibrin clots made in vitro from plasma of patients with acute ischemic stroke produced denser fibrin clots than healthy controls, as measured by fibrin clot compaction and permeability.[12] [33] In addition, it was suggested by scanning electron microscopy (SEM) experiments on in vitro clots from five stroke patients that fibrin clot density was higher compared to controls.[34] The three mentioned studies all reported on fibrin clot density, whereas in our study, we measured fibrin fiber density. Clot density and fiber density do not necessarily correlate, since the fibers within a clot may be different from the clot as a whole. It is therefore important to distinguish between these two variables when comparing results.
Our results indicated that plasma from recently diagnosed T2D patients who later develop stroke produces clots with lower fiber density than plasma from diabetes controls. These clots with less dense fibers might have an increased risk of embolization, giving rise to future thrombi and stroke. This is in accordance with results showing that clots formed from AF patients with previous stroke had higher lysability than clots from AF patients without previous stroke,[35] although we could not confirm effects on clot lysis in the present study. Overall, this suggests that low fiber density in the years prior to stroke increases the risk of ischemic stroke.
The tendency of positive association between fiber diameter and stroke risk observed in our study can be explained by the fact that thick fibers in a permeable network degrade more easily than thin fibers in a dense network due to increased permeability and availability and binding of fibrinolytic enzymes to the fiber surface,[36] thereby increasing the risk of embolization. We observed a weak association between baseline MA and future stroke risk, which is in line with reported correlations between MA and both fiber diameter and fibrinogen concentration.[31] In other studies, MA was reported to be higher in the acute phase of ischemic stroke[12] and in the convalescent phase after stroke[34] compared to controls.
We have previously shown that absolute, but not relative, levels of three fibrinogen isoforms (fibrinogen α E, fibrinogen γ′, and sialylated fibrinogen) are associated with risk of ischemic stroke in recently diagnosed T2D patients.[26] One of our study aims was therefore to investigate the correlation between these three fibrinogen isoforms and fibrin clot characteristics. Correlation analyses showed consistent associations between absolute, but not relative, levels of the fibrinogen variants and all measured clot characteristics in stroke cases and diabetes controls. This may indicate that high plasma levels of naturally occurring fibrinogen variants produce more pro-thrombotic fibrin clots.
Until now, the relation between fibrinogen variants and fibrin clot characteristics has been investigated in purified systems comparing the variants with normal fibrinogen.[20] [21] [23] [37] [38] Thus, fibrinogen α E showed reduced fibrin polymerization rate (V max) compared to normal fibrinogen, when analyzed by turbidity measurements. Moreover, Mosesson et al used SEM imaging to detect thinner fibrin fibers made of fibrinogen α E compared with fibers made of normal fibrinogen.[20] These effects could be explained by the lack of a negatively charged polymerization pocket in fibrinogen α E.[39] Cooper et al showed that clots made of purified fibrinogen γ′ had reduced fibrin fiber diameter, high density, reduced polymerization rate, and decreased MA compared with the more common isoform γ/γ fibrinogen.[21]
In vitro studies have shown decreased MA and either higher[37] or lower[38] fiber density in clots made of purified fibrinogen with a high content of sialic acids compared to clots made of fibrinogen with a low content of sialic acids. Clots made of fibrinogen depleted of sialic acids had a higher fiber diameter compared to normal fibrinogen.[23] Further, it has been suggested that sialic acids lead to increased net negative charge of fibrinogen and thereby increased electrostatic repulsive forces between fibrin monomers, resulting in prolonged fibrin polymerization rate.[22] [24] [25]
Overall, we expected these variant-specific effects observed in purified systems to be reflected in the associations between relative variant levels and clot properties in plasma. However, only the absolute variant levels are significantly with clot properties. The reason for these contradictory results is unknown, but it illustrates that it is difficult to compare in vitro studies of purified proteins with in vivo studies of plasma. The observed associations might simply reflect well-known associations between total fibrinogen and clot properties.
One of the methodological strengths of this study is that T2D patients were followed prospectively in Danish registries, allowing full follow-up of all participants, and stroke cases were matched with diabetes controls. Participants were recently diagnosed with T2D (<4 years before study inclusion), leaving the metabolic disturbances in the body at a minimum. Despite the obvious need, no standard approach is available for turbidity measurements. However, it is recommended that operators are well trained and that tPA is added just prior to the addition of thrombin and CaCl2 to avoid inactivation of tPA by inhibitors.[40] These suggestions were met in this study, since one experienced technician performed the turbidity measurements by following the protocol from Sjøland et al with modifications.[8]
The study also has limitations. During the years 2010 to 2021, most plasma samples in DD2 were mailed overnight at ambient temperature to the biobank due to logistical reasons in the nationwide DD2 setup.[28] According to the Clinical and Laboratory Standards Institute, plasma stored for more than 4 hours should be frozen.[41] We performed a pilot study (n = 10) and found that storage of plasma overnight at room temperature did not affect the variables of the fibrin clot characteristics, except that MA levels were significantly reduced (median reduction of 4.2%; [Supplementary Table S2]). This indicates that lower levels of MA are reported in this study than if the samples were handled according to CLSI. We previously reported a similar effect on fibrinogen α E.[26] In addition, plasma samples were only centrifuged once (platelet-poor plasma), with the risk of release of plasminogen activator inhibitor type 1 (PAI-1) from platelet remnants into plasma. However, plasma levels of PAI-1 are most likely not of major importance for our results due to the high concentration of t-PA added to induce clot lysis. Thus, even though samples from cases and controls were, on average, handled identically, we cannot rule out that overnight storage and single centrifugation of plasma might have affected the results. Further, degradation of fibrinogen and measures of fibrin clot properties during freezing for up to 15 years cannot be ruled out, as long-term stability of these variables has never been tested. However, a potential effect will be comparable in both groups. The sample size calculation was based on plasma fibrinogen γ′ as described elsewhere.[26] We may have made type II errors in the interpretation of the results for fibrin clot properties, and we did not perform subgroup analyses in, for example, patients with thromboembolic stroke or in women and men separately. Finally, the amount of plasma was very limited, and confirmation of the findings by additional methodology was not possible.
Conclusion
Fiber density was lower in patients with T2D who, over the next few years, developed stroke compared to matched diabetes controls, who did not develop stroke. Fiber density tended to be negatively associated with risk of ischemic stroke, while V max, MA, OHP, and fiber diameter tended to be positively associated with risk of ischemic stroke. In our study, including 144 stroke cases and 144 matched diabetes controls, fibrin clot characteristics assessed by turbidimetry were not clear and convincing predictors of future ischemic stroke in recently diagnosed patients with T2D, and larger studies are needed. Total fibrinogen and absolute, but not relative, levels of the three fibrinogen variants, fibrinogen α E, fibrinogen γ′, and sialylated fibrinogen correlated with measures of clot characteristics in T2D patients.
What is Known About this Topic?
-
Fibrin clot characteristics can be studied in vitro by turbidity and can serve as biomarkers in the understanding of development of ischemic stroke in e.g. patients with type 2 diabetes (T2D)
-
Fibrinogen variants associate with development of ischemic stroke in T2D.
What Does this Paper Add?
-
Fibrin fiber density tended to be negatively associated with stroke risk in T2D
-
The clot characteristics Vmax, MA, OHP and fiber diameter tended to be positively associated with stroke risk in T2D
-
Absolute levels of three fibrinogen variants correlated with clot characteristics in T2D.
Contributors' Statement
N.D.: funding acquisition, investigation, methodology, project administration, software, and writing—original draft, review, and editing. E.-M.B.: conceptualization, formal analysis, investigation, supervision, and writing—review and editing. H.M.L.S. and R.W.T.: formal analysis, software, and writing—review and editing. J.S.N.: conceptualization, formal analysis, methodology, and writing—review and editing. M.P.M.D.M.: conceptualization, data curation, formal analysis, investigation, supervision, and writing—review and editing. A.M.B.M.: conceptualization, formal analysis, investigation, supervision, and writing—review and editing.
Conflict of Interest
R.W.T. and H.S. are affiliated with the Department of Clinical Epidemiology, which is involved in studies with funding from various companies in the form of research grants to and administered by Aarhus University. None of these grants is related to the present study. J.S.N. is currently employed by Sanofi Danmark A/S. However, Sanofi Danmark A/S had no role in the design, preparation, writing, or decision to publish this article.
Acknowledgement
The authors would like to thank our technician, Anette Larsen, for performing the turbidity measurements.
-
References
- 1 Khan MAB, Hashim MJ, King JK, Govender RD, Mustafa H, Al Kaabi J. Epidemiology of type 2 diabetes - global burden of disease and forecasted trends. J Epidemiol Glob Health 2020; 10 (01) 107-111
- 2 Gyldenkerne C, Kahlert J, Olesen KKW. et al. Twenty-year temporal trends in risk of ischemic stroke in incident type 2 diabetes: a Danish population-based cohort study. Diabetes Care 2022; 45 (09) 2144-2151
- 3 Tsao CW, Aday AW, Almarzooq ZI. et al. Heart disease and stroke statistics—2022 update: a report from the American Heart Association. Circulation 2022; 145 (08) e153-e639
- 4 Boehme AK, Esenwa C, Elkind MSV. Stroke risk factors, genetics, and prevention. Circ Res 2017; 120 (03) 472-495
- 5 Hart RG, Diener HC, Coutts SB. et al; Cryptogenic Stroke/ESUS International Working Group. Embolic strokes of undetermined source: the case for a new clinical construct. Lancet Neurol 2014; 13 (04) 429-438
- 6 Weisel JW, Litvinov RI. Mechanisms of fibrin polymerization and clinical implications. Blood 2013; 121 (10) 1712-1719
- 7 Weisel JW, Litvinov RI. The biochemical and physical process of fibrinolysis and effects of clot structure and stability on the lysis rate. Cardiovasc Hematol Agents Med Chem 2008; 6 (03) 161-180
- 8 Sjøland JA, Sidelmann JJ, Brabrand M. et al. Fibrin clot structure in patients with end-stage renal disease. Thromb Haemost 2007; 98 (02) 339-345
- 9 Carr ME, Gabriel DA. Dextran-induced changes in fibrin fiber size and density based on wavelength dependence of gel turbidity. Macromolecules 1980; 13 (06) 1473-1477
- 10 Carr Jr ME, Hermans J. Size and density of fibrin fibers from turbidity. Macromolecules 1978; 11 (01) 46-50
- 11 Rooth E, Wallen NH, Blombäck M, He S. Decreased fibrin network permeability and impaired fibrinolysis in the acute and convalescent phase of ischemic stroke. Thromb Res 2011; 127 (01) 51-56
- 12 Pera J, Undas A, Topor-Madry R, Jagiella J, Klimkowicz-Mrowiec A, Slowik A. Fibrin clot properties in acute stroke: what differs cerebral hemorrhage from cerebral ischemia?. Stroke 2012; 43 (05) 1412-1414
- 13 Dunn EJ, Ariëns RA, Grant PJ. The influence of type 2 diabetes on fibrin structure and function. Diabetologia 2005; 48 (06) 1198-1206
- 14 Bryk AH, Konieczyńska M, Polak M, Plicner D, Bochenek M, Undas A. Plasma fibrin clot properties and cardiovascular mortality in patients with type 2 diabetes: a long-term follow-up study. Cardiovasc Diabetol 2021; 20 (01) 47
- 15 Luzak B, Boncler M, Kosmalski M. et al. Fibrinogen glycation and presence of glucose impair fibrin polymerization-an in vitro study of isolated fibrinogen and plasma from patients with diabetes mellitus. Biomolecules 2020; 10 (06) 877
- 16 Pieters M, Covic N, van der Westhuizen FH. et al. Glycaemic control improves fibrin network characteristics in type 2 diabetes - a purified fibrinogen model. Thromb Haemost 2008; 99 (04) 691-700
- 17 Hammer MR, John PN, Flynn MD, Bellingham AJ, Leslie RD. Glycated fibrinogen: a new index of short-term diabetic control. Ann Clin Biochem 1989; 26 (Pt 1): 58-62
- 18 Blombäck B, Carlsson K, Hessel B, Liljeborg A, Procyk R, Aslund N. Native fibrin gel networks observed by 3D microscopy, permeation and turbidity. Biochim Biophys Acta 1989; 997 (1–2): 96-110
- 19 Ryan EA, Mockros LF, Weisel JW, Lorand L. Structural origins of fibrin clot rheology. Biophys J 1999; 77 (05) 2813-2826
- 20 Mosesson MW, DiOrio JP, Hernandez I, Hainfeld JF, Wall JS, Grieninger G. The ultrastructure of fibrinogen-420 and the fibrin-420 clot. Biophys Chem 2004; 112 (2–3): 209-214
- 21 Cooper AV, Standeven KF, Ariëns RAS. Fibrinogen gamma-chain splice variant gamma' alters fibrin formation and structure. Blood 2003; 102 (02) 535-540
- 22 Gralnick HR, Givelber H, Abrams E. Dysfibrinogenemia associated with hepatoma. Increased carbohydrate content of the fibrinogen molecule. N Engl J Med 1978; 299 (05) 221-226
- 23 Dang CV, Shin CK, Bell WR, Nagaswami C, Weisel JW. Fibrinogen sialic acid residues are low affinity calcium-binding sites that influence fibrin assembly. J Biol Chem 1989; 264 (25) 15104-15108
- 24 Maghzal GJ, Brennan SO, George PM. The sialic acid content of fibrinogen decreases during pregnancy and increases in response to fibrate therapy. Thromb Res 2005; 115 (04) 293-299
- 25 Martinez J, MacDonald KA, Palascak JE. The role of sialic acid in the dysfibrinogenemia associated with liver disease: distribution of sialic acid on the constituent chains. Blood 1983; 61 (06) 1196-1202
- 26 Daugaard N, Bladbjerg EM, Svane HML. et al. Association of fibrin clot characteristics with development of ischemic stroke in patients with newly diagnosed type 2 diabetes. J Thromb Haemost 2025
- 27 Nielsen JS, Thomsen RW, Steffensen C, Christiansen JS. The Danish Centre for Strategic Research in Type 2 Diabetes (DD2) study: implementation of a nationwide patient enrollment system. Clin Epidemiol 2012; 4 (Suppl. 01) 27-36
- 28 Christensen H, Nielsen JS, Sørensen KM, Melbye M, Brandslund I. New national Biobank of The Danish Center for Strategic Research on Type 2 Diabetes (DD2). Clin Epidemiol 2012; 4: 37-42
- 29 Christensen DH, Nicolaisen SK, Berencsi K. et al. Danish Centre for Strategic Research in Type 2 Diabetes (DD2) project cohort of newly diagnosed patients with type 2 diabetes: a cohort profile. BMJ Open 2018; 8 (04) e017273
- 30 Weisel JW, Nagaswami C. Computer modeling of fibrin polymerization kinetics correlated with electron microscope and turbidity observations: clot structure and assembly are kinetically controlled. Biophys J 1992; 63 (01) 111-128
- 31 Pieters M, Guthold M, Nunes CM, de Lange Z. Interpretation and validation of maximum absorbance data obtained from turbidimetry analysis of plasma clots. Thromb Haemost 2020; 120 (01) 44-54
- 32 Antovic A. The overall hemostasis potential: a laboratory tool for the investigation of global hemostasis. Semin Thromb Hemost 2010; 36 (07) 772-779
- 33 Undas A, Slowik A, Wolkow P, Szczudlik A, Tracz W. Fibrin clot properties in acute ischemic stroke: relation to neurological deficit. Thromb Res 2010; 125 (04) 357-361
- 34 Undas A, Podolec P, Zawilska K. et al. Altered fibrin clot structure/function in patients with cryptogenic ischemic stroke. Stroke 2009; 40 (04) 1499-1501
- 35 Skov J, Sidelmann JJ, Bladbjerg EM, Jespersen J, Gram J. Lysability of fibrin clots is a potential new determinant of stroke risk in atrial fibrillation. Thromb Res 2014; 134 (03) 717-722
- 36 Collet JP, Park D, Lesty C. et al. Influence of fibrin network conformation and fibrin fiber diameter on fibrinolysis speed: dynamic and structural approaches by confocal microscopy. Arterioscler Thromb Vasc Biol 2000; 20 (05) 1354-1361
- 37 Moiseiwitsch N, Zwennes N, Szlam F, Sniecinski R, Brown A. COVID-19 patient fibrinogen produces dense clots with altered polymerization kinetics, partially explained by increased sialic acid. J Thromb Haemost 2022; 20 (12) 2909-2920
- 38 Nellenbach K, Kyu A, Guzzetta N, Brown AC. Differential sialic acid content in adult and neonatal fibrinogen mediates differences in clot polymerization dynamics. Blood Adv 2021; 5 (23) 5202-5214
- 39 Applegate D, Haraga L, Hertzberg KM. et al. The EC domains of human fibrinogen420 contain calcium binding sites but lack polymerization pockets. Blood 1998; 92 (10) 3669-3674
- 40 Pieters M, Philippou H, Undas A, de Lange Z, Rijken DC, Mutch NJ. Subcommittee on Factor XIII and Fibrinogen, and the Subcommittee on Fibrinolysis. An international study on the feasibility of a standardized combined plasma clot turbidity and lysis assay: communication from the SSC of the ISTH. J Thromb Haemost 2018; 16 (05) 1007-1012
- 41 Adcock Funk DM, Lippi G, Favaloro EJ. Quality standards for sample processing, transportation, and storage in hemostasis testing. Semin Thromb Hemost 2012; 38 (06) 576-585
- 42 Daugaard N, Bladbjerg EM, Lundsgaard Svane HM. et al. Association of fibrinogen αE, fibrinogen γ′, and sialylated fibrinogen with development of ischemic stroke in patients with recently diagnosed type 2 diabetes. J Thromb Haemost 2025; 23 (07) 2213-2225
Correspondence
Publication History
Received: 23 September 2025
Accepted: 31 January 2026
Accepted Manuscript online:
03 February 2026
Article published online:
24 February 2026
© 2026. The Author(s). This is an open access article published by Thieme under the terms of the Creative Commons Attribution-NonDerivative-NonCommercial License, permitting copying and reproduction so long as the original work is given appropriate credit. Contents may not be used for commercial purposes, or adapted, remixed, transformed or built upon. (https://creativecommons.org/licenses/by-nc-nd/4.0/)
Georg Thieme Verlag KG
Oswald-Hesse-Straße 50, 70469 Stuttgart, Germany
Nicoline Daugaard, Else-Marie Bladbjerg, Helene M. L. Svane, Reimar W. Thomsen, Jens S. Nielsen, Moniek P. M. de Maat, Anna-Marie B. Münster. Association of Fibrin Clot Characteristics with Development of Ischemic Stroke in Patients with Recently Diagnosed Type 2 Diabetes. TH Open 2026; 10: a28023514.
DOI: 10.1055/a-2802-3514
-
References
- 1 Khan MAB, Hashim MJ, King JK, Govender RD, Mustafa H, Al Kaabi J. Epidemiology of type 2 diabetes - global burden of disease and forecasted trends. J Epidemiol Glob Health 2020; 10 (01) 107-111
- 2 Gyldenkerne C, Kahlert J, Olesen KKW. et al. Twenty-year temporal trends in risk of ischemic stroke in incident type 2 diabetes: a Danish population-based cohort study. Diabetes Care 2022; 45 (09) 2144-2151
- 3 Tsao CW, Aday AW, Almarzooq ZI. et al. Heart disease and stroke statistics—2022 update: a report from the American Heart Association. Circulation 2022; 145 (08) e153-e639
- 4 Boehme AK, Esenwa C, Elkind MSV. Stroke risk factors, genetics, and prevention. Circ Res 2017; 120 (03) 472-495
- 5 Hart RG, Diener HC, Coutts SB. et al; Cryptogenic Stroke/ESUS International Working Group. Embolic strokes of undetermined source: the case for a new clinical construct. Lancet Neurol 2014; 13 (04) 429-438
- 6 Weisel JW, Litvinov RI. Mechanisms of fibrin polymerization and clinical implications. Blood 2013; 121 (10) 1712-1719
- 7 Weisel JW, Litvinov RI. The biochemical and physical process of fibrinolysis and effects of clot structure and stability on the lysis rate. Cardiovasc Hematol Agents Med Chem 2008; 6 (03) 161-180
- 8 Sjøland JA, Sidelmann JJ, Brabrand M. et al. Fibrin clot structure in patients with end-stage renal disease. Thromb Haemost 2007; 98 (02) 339-345
- 9 Carr ME, Gabriel DA. Dextran-induced changes in fibrin fiber size and density based on wavelength dependence of gel turbidity. Macromolecules 1980; 13 (06) 1473-1477
- 10 Carr Jr ME, Hermans J. Size and density of fibrin fibers from turbidity. Macromolecules 1978; 11 (01) 46-50
- 11 Rooth E, Wallen NH, Blombäck M, He S. Decreased fibrin network permeability and impaired fibrinolysis in the acute and convalescent phase of ischemic stroke. Thromb Res 2011; 127 (01) 51-56
- 12 Pera J, Undas A, Topor-Madry R, Jagiella J, Klimkowicz-Mrowiec A, Slowik A. Fibrin clot properties in acute stroke: what differs cerebral hemorrhage from cerebral ischemia?. Stroke 2012; 43 (05) 1412-1414
- 13 Dunn EJ, Ariëns RA, Grant PJ. The influence of type 2 diabetes on fibrin structure and function. Diabetologia 2005; 48 (06) 1198-1206
- 14 Bryk AH, Konieczyńska M, Polak M, Plicner D, Bochenek M, Undas A. Plasma fibrin clot properties and cardiovascular mortality in patients with type 2 diabetes: a long-term follow-up study. Cardiovasc Diabetol 2021; 20 (01) 47
- 15 Luzak B, Boncler M, Kosmalski M. et al. Fibrinogen glycation and presence of glucose impair fibrin polymerization-an in vitro study of isolated fibrinogen and plasma from patients with diabetes mellitus. Biomolecules 2020; 10 (06) 877
- 16 Pieters M, Covic N, van der Westhuizen FH. et al. Glycaemic control improves fibrin network characteristics in type 2 diabetes - a purified fibrinogen model. Thromb Haemost 2008; 99 (04) 691-700
- 17 Hammer MR, John PN, Flynn MD, Bellingham AJ, Leslie RD. Glycated fibrinogen: a new index of short-term diabetic control. Ann Clin Biochem 1989; 26 (Pt 1): 58-62
- 18 Blombäck B, Carlsson K, Hessel B, Liljeborg A, Procyk R, Aslund N. Native fibrin gel networks observed by 3D microscopy, permeation and turbidity. Biochim Biophys Acta 1989; 997 (1–2): 96-110
- 19 Ryan EA, Mockros LF, Weisel JW, Lorand L. Structural origins of fibrin clot rheology. Biophys J 1999; 77 (05) 2813-2826
- 20 Mosesson MW, DiOrio JP, Hernandez I, Hainfeld JF, Wall JS, Grieninger G. The ultrastructure of fibrinogen-420 and the fibrin-420 clot. Biophys Chem 2004; 112 (2–3): 209-214
- 21 Cooper AV, Standeven KF, Ariëns RAS. Fibrinogen gamma-chain splice variant gamma' alters fibrin formation and structure. Blood 2003; 102 (02) 535-540
- 22 Gralnick HR, Givelber H, Abrams E. Dysfibrinogenemia associated with hepatoma. Increased carbohydrate content of the fibrinogen molecule. N Engl J Med 1978; 299 (05) 221-226
- 23 Dang CV, Shin CK, Bell WR, Nagaswami C, Weisel JW. Fibrinogen sialic acid residues are low affinity calcium-binding sites that influence fibrin assembly. J Biol Chem 1989; 264 (25) 15104-15108
- 24 Maghzal GJ, Brennan SO, George PM. The sialic acid content of fibrinogen decreases during pregnancy and increases in response to fibrate therapy. Thromb Res 2005; 115 (04) 293-299
- 25 Martinez J, MacDonald KA, Palascak JE. The role of sialic acid in the dysfibrinogenemia associated with liver disease: distribution of sialic acid on the constituent chains. Blood 1983; 61 (06) 1196-1202
- 26 Daugaard N, Bladbjerg EM, Svane HML. et al. Association of fibrin clot characteristics with development of ischemic stroke in patients with newly diagnosed type 2 diabetes. J Thromb Haemost 2025
- 27 Nielsen JS, Thomsen RW, Steffensen C, Christiansen JS. The Danish Centre for Strategic Research in Type 2 Diabetes (DD2) study: implementation of a nationwide patient enrollment system. Clin Epidemiol 2012; 4 (Suppl. 01) 27-36
- 28 Christensen H, Nielsen JS, Sørensen KM, Melbye M, Brandslund I. New national Biobank of The Danish Center for Strategic Research on Type 2 Diabetes (DD2). Clin Epidemiol 2012; 4: 37-42
- 29 Christensen DH, Nicolaisen SK, Berencsi K. et al. Danish Centre for Strategic Research in Type 2 Diabetes (DD2) project cohort of newly diagnosed patients with type 2 diabetes: a cohort profile. BMJ Open 2018; 8 (04) e017273
- 30 Weisel JW, Nagaswami C. Computer modeling of fibrin polymerization kinetics correlated with electron microscope and turbidity observations: clot structure and assembly are kinetically controlled. Biophys J 1992; 63 (01) 111-128
- 31 Pieters M, Guthold M, Nunes CM, de Lange Z. Interpretation and validation of maximum absorbance data obtained from turbidimetry analysis of plasma clots. Thromb Haemost 2020; 120 (01) 44-54
- 32 Antovic A. The overall hemostasis potential: a laboratory tool for the investigation of global hemostasis. Semin Thromb Hemost 2010; 36 (07) 772-779
- 33 Undas A, Slowik A, Wolkow P, Szczudlik A, Tracz W. Fibrin clot properties in acute ischemic stroke: relation to neurological deficit. Thromb Res 2010; 125 (04) 357-361
- 34 Undas A, Podolec P, Zawilska K. et al. Altered fibrin clot structure/function in patients with cryptogenic ischemic stroke. Stroke 2009; 40 (04) 1499-1501
- 35 Skov J, Sidelmann JJ, Bladbjerg EM, Jespersen J, Gram J. Lysability of fibrin clots is a potential new determinant of stroke risk in atrial fibrillation. Thromb Res 2014; 134 (03) 717-722
- 36 Collet JP, Park D, Lesty C. et al. Influence of fibrin network conformation and fibrin fiber diameter on fibrinolysis speed: dynamic and structural approaches by confocal microscopy. Arterioscler Thromb Vasc Biol 2000; 20 (05) 1354-1361
- 37 Moiseiwitsch N, Zwennes N, Szlam F, Sniecinski R, Brown A. COVID-19 patient fibrinogen produces dense clots with altered polymerization kinetics, partially explained by increased sialic acid. J Thromb Haemost 2022; 20 (12) 2909-2920
- 38 Nellenbach K, Kyu A, Guzzetta N, Brown AC. Differential sialic acid content in adult and neonatal fibrinogen mediates differences in clot polymerization dynamics. Blood Adv 2021; 5 (23) 5202-5214
- 39 Applegate D, Haraga L, Hertzberg KM. et al. The EC domains of human fibrinogen420 contain calcium binding sites but lack polymerization pockets. Blood 1998; 92 (10) 3669-3674
- 40 Pieters M, Philippou H, Undas A, de Lange Z, Rijken DC, Mutch NJ. Subcommittee on Factor XIII and Fibrinogen, and the Subcommittee on Fibrinolysis. An international study on the feasibility of a standardized combined plasma clot turbidity and lysis assay: communication from the SSC of the ISTH. J Thromb Haemost 2018; 16 (05) 1007-1012
- 41 Adcock Funk DM, Lippi G, Favaloro EJ. Quality standards for sample processing, transportation, and storage in hemostasis testing. Semin Thromb Hemost 2012; 38 (06) 576-585
- 42 Daugaard N, Bladbjerg EM, Lundsgaard Svane HM. et al. Association of fibrinogen αE, fibrinogen γ′, and sialylated fibrinogen with development of ischemic stroke in patients with recently diagnosed type 2 diabetes. J Thromb Haemost 2025; 23 (07) 2213-2225