Keywords
prostate neoplasm - metabolomics - prostate cancer - lactate - nuclear magnetic resonance
Palabras clave
neoplasia de la próstata - metabolómica - cáncer de próstata - lactato - resonancia magnética
Introduction
Prostate cancer (PCa) is the second most frequent malignant neoplasia diagnosed in men (mainly in those aged > 65 years) in both developing and developed countries after skin cancer), and it is one of the leading causes of cancer death.[1]
[2]
[3] A public health concern in developed countries, in which older adults account for the most significant proportion of the population,[4] PCa is a heterogeneous disease with a variable natural history. It may display latency periods of up to 20 years in which it remains confined to the organ. Although prostate cancer lesions can remain localized for long periods, more aggressive forms may occur. When metastasis occurs, the lymph nodes and bones are predominantly affected, with detrimental results.[5] Patients with high risk and susceptibility to develop PCa require recurrent screening over time, with age, ethnicity, and family history being the most important risk factors.[6]
Concerns were raised about the diagnosis and early treatments of this disease due to the absence of specific markers.[7] To date, the gold standard for the diagnosis of PCa is an invasive procedure consisting of a histopathological evaluation of the prostate, a procedure with significant morbidity.[8] Currently, the use of the prostate-specific antigen (PSA) as a screening and monitoring marker for PCa is widespread,[9] but there is still a debate about how to screen for PCa among men in the overall population. The PSA is prostate-specific, but it has a low specificity and could also increase unnecessary biopsies without lowering mortality.[10]
In the search for new biomarkers, metabolomics is the established ‘-omics’ family. It measures the systemic activity and conditions in the human body and suggests that metabolism dysregulation plays a fundamental role in the development and progression of common conditions and malignancies.[11]
Specifically, the metabolism of prostate cells the components of the prostatic fluid, such as PSA, spermine, myoinositol, and citrate (with higher levels than in any other organ). In PCa, cells lose the ability to accumulate citrate by lowering the levels of zinc.[11] Additionally, there is evidence that chronic inflammation and related markers like metabolic syndrome increase tumor growth.[12]
Metabolomics employs different techniques to identify biomolecules.[13] So far, the most promising biomarkers identified for the diagnosis of PCa, through high-throughput liquid and gas chromatography-tandem mass spectrometry and high-resolution magic-angle-spinning proton magnetic resonance spectroscopy in plasma, urine, and tissue are sarcosine (area under the curve [AUC]: 0.67),[14] choline, phosphocholines (AUC: 0.982),[15] phosphorylcholines, carnitines (AUC: 0.97),[16] citrate (AUC: 0.89),[17] amino acids (lysine, glutamine, and ornithine),[18]
[19]
[20]
[21] arachidonoyl amine (AUC: 0.86)[16] and lysophospholipids (steroid hormone biosynthesis pathway and bile acids – sensitivity: 92%; specificity: 94%).[20]
The present study aimed to identify the metabolites associated with patients with malignant prostate disturbances compared with non-cancer patients.
Methods
The present is an observational study. Two populations were sampled from a pool of male candidates at risk of PCa considering their elevated PSA or abnormal result on the digital rectal examination. Group 1 was composed of patients with localized PCa who were characterized according to the risk classification, and group 2 consisted of patients with prostate biopsy negative for malignancy. All samples were taken from patients in the Urology Section of Hospital Universitario del Valle and the Prostate Biopsy Section of Clínica Rafael Uribe Uribe, in Cali, Colombia.
Exclusion Criteria
Patients were excluded when the following conditions were found: other concomitant cancer types, coagulation disorders, and renal or metabolic disorders such as diabetes mellitus, gout, or hyperthyroidism. Additionally, patients were excluded if they had symptoms of acute diseases two weeks before the sample collection, such as a febrile episode, cough, headache, diarrhea, hematuria, and psychic disorders or episodes of traumatic stress. Ingestion of medications up to two weeks before the collection of samples, such as antibiotics, hormones, non-steroidal anti-inflammatory drugs, as well as the performance of chemotherapy or radiotherapy also led to exclusion.
Collection of Samples and Sample Size
Sampling was performed by convenience and according to the availability of the patients admitted to each hospital. They were instructed and requested to sign an informed consent form prior to providing the samples. Each patient was informed about the risks and benefits of both the procedure and the research project. The patients provided a blood sample and were submitted to the standard prostate biopsy procedure to confirm the diagnosis.
Handling Samples
Blood Sampling Procedure
The procedure was performed by staff trained in sampling in humans. After the collection, the blood was mixed by manual rotation of the tube for 8 to 10 times. It was stored in vacutainer tubes (collection tubes with ethylenediaminetetraacetic acid [EDTA]) vertically at 4°C until centrifugation. The samples were transported within two hours of the collection.
Procedure for Separating the Plasma
Prior to the centrifugation, the centrifuge was allowed to cool to 4°C. Previously, an aliquot of 500 μL of phosphate buffer with a pH of 7.4 (0.142M of Na2HPO4) was taken in 1.5 mL Eppendorf (Eppendorf AG, Hamburg, Germany) tubes.
The blood samples were centrifuged at 4°C in a rotor (oscillating head) for 5 minutes at 4,000 rpm. After centrifugation, 250 μL of the plasma layer was taken with an appropriate micropipette without disturbing the buffy coat layer, and it was stored in a -80°C biofreezer.
Preparation for Resonance
Each sample was thawed at room temperature and centrifuged at 12,000 g at 4°C for 5 minutes. A total of 65 μL of phosphate uffer with a pH of 7.4 (0.142M Na2HPO4), prepared with D2O and 3-(trimethylsilyl)propionic-2,2,3,3-d4 acid sodium salt (TSP), and 585 μL of the sample were added. The sample was centrifuged again at 12,000 g at 4°C for 5 minutes. Finally, 600 μL of supernatant was transferred to a 5-mm nuclear magnetic resonance (NMR) tube.
Proton nuclear magnetic resonance (1H-NMR) spectra were acquired on the Bruker Avance II Ultra Shield 400 MHz spectrometer (Bruker BioSpin, Rheinstetten, Germany) with a direct broadband observe (BBO) probe equipped with 3 gradients at a temperature of 300° K. The temperature regulation of the probe head was calibrated using pure methanol samples. The final spectra were obtained using a standard Carr-Purcell-Meiboom-Gill (CPMG) pulse sequence, and 64 scans were accumulated. The observed window was of 12 ppm, and the relaxation delay was of 4 seconds. Presaturation of the water signal was necessary to attenuate the intense signal of the solvent. The CPMG block in the pulse sequence enables the removal from the spectrum of signals belonging to molecules of high molecular weight, improving the baseline quality. Prior to each acquisition, the resonance frequency and the homogeneity of the magnetic field were adjusted automatically, while calibration of the solvent suppression was performed manually. The spectra were referenced concerning the resonance of the α-glucose doublet at δ 5.233 ppm, since it is known that TSP can aggregate with the proteins present in the sample.[22]
Data Analysis
The resulting data matrix was preprocessed using the R (R Foundation for Statistical Computing, Vienna, Austria) software.[23] First, a baseline correction was applied. Then, the TSP regions, and the water and anticoagulant signals were cut from the spectrum. Second, binning and Pareto scaling were performed for the remaining spectrum between δ 0.1 ppm and 6.0 ppm. Third, principal component analysis (PCA) was performed to inspect the data quality and highlight outliers visually; then, Orthogonal Projections to Latent Structures Discriminant Analysis (OPLS-DA) was applied. Accordingly, metabolites were identified with the support of statistical total correlation spectroscopy (STOCSY) analysis.
Ethics
The present study fulfils all international ethical requirements for research in humans, and was approved by the Institutional Review Board at Universidad del Valle.
Results
We collected plasma samples from 32 patients admitted upon suspicion of PCa; 12 patients were confirmed positive, while the remaining 20 were not. The median age of the sample was of 69.5 years, ranging from 46 to 82 years. All patients confirmed positive had localized PCa with no evidence of metastasis in further studies ([Table 1]). After collecting the samples, acquiring the profiles, and referencing glucose, 12 metabolites were assigned according to the study by Barton et al.[24] The metabolomic profile of a sample of healthy human plasma is displayed in [Fig. 1].
Table 1
Characteristics of the study sample
|
Age
|
Ethnicity
|
Setting
|
History
|
Urethral catheter
|
PSA
|
Histology
|
Tumor
|
ISUP
|
Risk group
|
|
Patients with Cancer
|
|
57
|
Black
|
Cali
|
No
|
No
|
8.01
|
Acinar adenocarcinoma
|
T2a
|
1
|
Low
|
|
74
|
Multiethnic
|
Sabaneta
|
No
|
No
|
9.05
|
Acinar adenocarcinoma
|
T2a
|
1
|
Low
|
|
61
|
Multiethnic
|
Cali
|
No
|
No
|
15.3
|
Acinar adenocarcinoma
|
T1c
|
1
|
Intermediate
|
|
67
|
Black
|
Tumaco
|
No
|
No
|
11.2
|
Acinar adenocarcinoma
|
T2a
|
1
|
Intermediate
|
|
60
|
Black
|
Puerto Tejada
|
No
|
No
|
14.82
|
Acinar adenocarcinoma
|
T2a
|
1
|
Intermediate
|
|
78
|
Multiethnic
|
Cali
|
No
|
No
|
20.2
|
Acinar adenocarcinoma
|
T2a
|
1
|
High
|
|
82
|
Black
|
Zarzal
|
No
|
No
|
16.61
|
Acinar adenocarcinoma
|
T2c
|
1
|
High
|
|
74
|
Multiethnic
|
Popayán
|
No
|
No
|
15.99
|
Acinar adenocarcinoma
|
T2c
|
1
|
High
|
|
65
|
Multiethnic
|
Santander de Quilichao
|
No
|
No
|
7.08
|
Acinar adenocarcinoma
|
T2c
|
1
|
High
|
|
82
|
Multiethnic
|
Cali
|
No
|
No
|
13.74
|
Acinar adenocarcinoma
|
T2a
|
4
|
High
|
|
77
|
Multiethnic
|
Silvia
|
No
|
Yes
|
75.85
|
Acinar adenocarcinoma
|
T2c
|
3
|
High
|
|
63
|
Multiethnic
|
Cali
|
No
|
No
|
20.9
|
Acinar adenocarcinoma
|
T2c
|
2
|
High
|
|
Included patients without Cancer
|
|
75
|
Multiethnic
|
Cali
|
No
|
No
|
4.88
|
Negative for malignancy
|
|
|
|
|
54
|
Multiethnic
|
Cali
|
No
|
No
|
10.1
|
Negative for malignancy
|
|
|
|
|
60
|
Multiethnic
|
Cali
|
No
|
No
|
8
|
Negative for malignancy
|
|
|
|
|
73
|
Multiethnic
|
Pradera
|
No
|
Yes
|
38
|
Negative for malignancy
|
|
|
|
|
51
|
Multiethnic
|
Cali
|
No
|
No
|
4.24
|
Chronic prostatitis
|
|
|
|
|
72
|
Multiethnic
|
Cali
|
No
|
No
|
5.25
|
Chronic prostatitis
|
|
|
|
|
64
|
Multiethnic
|
Santander de Quilichao
|
No
|
No
|
3.12
|
Benign prostatic tissue/Chronic prostatitis (IHC)
|
|
|
|
|
77
|
Multiethnic
|
Cali
|
No
|
No
|
11.3
|
Benign hyperplasia/Chronic prostatitis/Glandular atrophy/Atypical acini
|
|
|
|
|
54
|
Black
|
Cali
|
One relative with Pca
|
No
|
12.16
|
Chronic prostatitis/Glandular atrophy (IHC)
|
|
|
|
|
70
|
Multiethnic
|
Pradera
|
Two relatives with Pca
|
No
|
10.8
|
Glandular atrophy (IHC)
|
|
|
|
|
66
|
Multiethnic
|
Palmira
|
No
|
No
|
6.63
|
Glandular atrophy (IHC)
|
|
|
|
|
65
|
Multiethnic
|
Cali
|
No
|
No
|
4.37
|
Atypical acinar proliferation/Glandular atrophy (IHC)
|
|
|
|
|
77
|
Multiethnic
|
Cali
|
No
|
Yes
|
10.57
|
Atypical acinar proliferation/Glandular atrophy (IHC)
|
|
|
|
|
73
|
Multiethnic
|
Cali
|
No
|
No
|
8.4
|
High-grade prostatic intraepithelial neoplasia (IHC)
|
|
|
|
|
73
|
Multiethnic
|
Cajibio
|
No
|
No
|
8.61
|
Glandulostromal hyperplasia/Chronic prostatitis/Glandular atrophy
|
|
|
|
|
69
|
Multiethnic
|
Cisneros, Juntas Dagua
|
No
|
No
|
5.07
|
Glandulostromal hyperplasia/Chronic prostatitis/Glandular atrophy
|
|
|
|
|
73
|
Multiethnic
|
Restrepo
|
One relative with Pca
|
No
|
6.85
|
Benign hyperplasia/Chronic prostatitis/Glandular atrophy/Atypical acini
|
|
|
|
|
46
|
Multiethnic
|
Dagua
|
No
|
No
|
19
|
Glandulostromal Hyperplasia/Acute and chronic prostatitis/Glandular atrophy
|
|
|
|
|
71
|
Multiethnic
|
Cali
|
No
|
No
|
11
|
Glandulostromal hyperplasia/Acute and chronic prostatitis/Glandular atrophy
|
|
|
|
|
69
|
Multiethnic
|
Palmira
|
No
|
No
|
9.55
|
Glandulostromal hyperplasia/Acute and chronic prostatitis/Glandular atrophy
|
|
|
|
Abbreviations: IHC, immunohistochemistry; ISUP, International Society of Urological Pathology grading. PCa, prostate cancer; PSA, prostate-specific antigen.
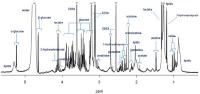 Fig. 1
1H-NMR-based metabolomic profile of a sample of healthy human plasma.
Fig. 1
1H-NMR-based metabolomic profile of a sample of healthy human plasma.
Principal Component Analysis
Four samples were located outside the confidence interval of the PCA models. Three corresponded to samples with an intense signal of ethanol (two healthy and one with cancer), indicating probable contamination during recollection, while one sample (of a cancer patient) had an intense lipid signal.
The resulting PCA model ([Fig. 2a]) explains more than 50% of the variance with just two components. Two groups emerged, showing that the data contained discriminant information. [Fig. 2b] displays the same model but colored according to the risk of progression measured by the D'amico classification. Patients with a high risk of progression were found more condensed, which was expected despite the low number of samples.
 Fig. 2 Principal component analysis: a. Healthy patients, b. Cancer patients, c. Cancer and non-cancer patients and d. Risk of progression.
Subgroup by the Risk of Progression Analysis
Although the sample of the present study was small, we can show that the most critical and discriminative samples with cancer have a high risk of progression. Accordingly, the patients with low and intermediate risks are apart from this group of patients ([Fig. 2d]).
OPLS-DA Model
The same profiles were used to build a supervised model analysis. The OPLS-DA was chosen for its wide acceptance and ease of interpretation. We applied the 5-fold method to 15 non-cancer patients and 10 patients with cancer, which resulted in a discriminative expression of both groups (R2 = 0.5902; Q2 = 0.3302; [Fig. 3a]). Additionally, we described the loadings plot to identify the metabolites associated with cancer ([Fig. 3b] and [Fig. 3c]).
 Fig. 3 OPLS-DA and loadings plots.
The metabolites associated with PCa were shown in the 1D graph of the STOCSY analysis to discriminate metabolites better. [Fig. 4a] shows loading 657 (lipids), and [Fig. 4b], loading 647 (lactate), which were found to be positively associated with PCa.
 Fig. 4 STOCSY 1D graphs.
Discussion
Summary of the Main Results
According to the PCA, there was a consistent difference between the two groups of patients, mainly regarding the high risk of progression in PCa patients. The two essential metabolites that discriminate patients with and without PCa were lactate and lipids in plasma samples.
Contrast with the Literature
In 1920, it was described that cancer cells, even in the presence of oxygen, produce adenosine triphosphate (ATP) through the anaerobic pathway (anaerobic glycolysis) instead of the tricarboxylic acid cycle (Krebs cycle). The Warburg effect consists of the ability to sustain high rates of glycolysis for the generation of ATP.[25] In prostatic epithelial cells, we find an overexpression of zinc-regulated transporter/iron-regulated transporter-like protein 1(ZIP1), which inhibits mitochondrial aconitase (m-aconitase) in the tricarboxylic acid cycle. This leads to an accumulation of citrate in the healthy prostate.[26] In PCa, the concentration of ZIP1 lowers, since the malignant tissue cannot accumulate zinc. Therefore, anaerobic glycolysis increases, overproducing lactate. This process might herald the early development of PCa, even before it affects histology.[26]
Thus, lactate has been associated with the progression of the tumor and with pyruvate and alanine. As a pathway modulator, lactate has been studied as a urine biomarker for the non-invasive detection of PCa. Nonetheless, there are no consistent results among studies.[27]
There is an essential difference in PCa regarding glucose metabolism due to androgen receptor (AR) signaling. It has been described that glycolysis differs between cells sensitive (early stages) and non-sensitive (advanced) to androgen .[27]
[28] The androgen receptor also regulates the activity of several genes related to glucose consumption, such as hexokinase-2 (HKII), pentose phosphate pathway (PPP), and calcium/calmodulin-dependent protein kinase β (CaMKKB), among others. Overall, the AR stimulates glycolysis and anabolic metabolism.[27]
Regarding metabolomics, we present an experiment based on plasma samples and NMR, which is broadly accepted in literature and could be used in a clinical environment. Plasma offers several advantages, such as the fact that it is easier to obtain, presents fewer diurnal variations, and is less invasive than a prostate biopsy. On the other hand, sample preparation is more tedious than that of urine, and the plasma contains a higher concentration of proteins.[26]
Our results indicate a dysregulation in the energetics pathway according to the differences in lactate and lipids between the groups. Other studies[29] describing the use of 1H-NMR in plasma samples found, on the one hand, increased levels of alanine, pyruvate, and sarcosine, and lower levels of glycine, associated with disturbances in energetic metabolism and lipogenesis, and alterations in glycine synthesis and degradation. On the other hand, lower levels were reported for acylcarnitines, Choline, and arginine due to alterations in the metabolism of fatty acids, the phospholipid membrane, and amino acids.[30]
Other studies[19]
[31]
[32]
[33] relying on different analytical techniques (liquid and gas chromatography-tandem mass spectrometry) have found similar results with different biomarkers: alterations in lipid metabolism, disturbances in growth inhibition and induction of apoptosis, and alterations in amino acid and energetic metabolism (increased levels of palmitic acid, linolenic acid, aspartic acid, choline, alanine, lysine, sarcosine, and phosphatidylcholine, and low levels of ornithine, stearic acid, glutamine, valine, tryptophan, dehydroepiandrosterone (DHEAS), epiandrosterone sulfate, carnitines, 2-hydroxybutyrate, and ketone bodies, among others).
Authors worldwide have evaluated a plethora of biomarker candidates for the diagnosis and prognosis of PCa patients. In the blood, the most relevant biomarker for diagnosis are citrate, glycine, glycerol-3-phosphate, and alanine; and, regarding prognosis, citrate and alanine.[34]
Eidelman et al.[35] and Andersen et al.[36] consider the metabolomic profile a trending topic in PCa research. They have also reported citrate/zinc, lactate, glutamine, arginine, lipids, and other critical metabolic pathways as vital for the development of better diagnostic methods and treatment options for PCa patients. These all are considered part of the metabolic phenotype of PCa.[35]
[36] As aforementioned, other key metabolites are essential when differentiating patients with and without cancer, such as phosphocholine, glutamate, hypoxanthine, arginine, and alfa-glucose. Tumor aggressiveness, which is also essential in the decision-making process, must also be considered.[37] Nonetheless, it0 is essential to consider that none of these tools are currently available for use in clinical practice.
Strengths and Limitations
The present is the first observational study conducted in Colombia for the early identification of biomarkers in localized PCa through metabolomics. We implemented a method to analyze the samples through NMR and found exciting results to better understand the pathophysiology of PCa. The validation of lactate and lipids as biomarkers might be performed through studies with a larger population to extrapolate results, so that the use of these metabolites and this technique may be considered as a method for early screening or to diagnose PCa.
Regarding the limitations, we found the following to be considered in the subsequent trials: low sample size and the lack of association with mass spectrometry (MS) to complement and identify low-weight molecules (lipidomics).
Conclusions
The main differences between patients with and without PCa regarding their metabolomics profiles confirmed that lactate and lipids are the most reliable biomarkers to track the development of cancer in the prostate.
We suggest continuing research in metabolomics to elucidate what happens in the prostate when malignant disturbances present.


