

Subscribe to RSS
DOI: 10.1055/s-0044-1787837
Imaging in Abdominal Tuberculosis
Authors
Funding None.

Abstract
Diagnosis of abdominal tuberculosis is challenging due to its variable imaging appearance, which can mimic several other conditions. This review covers the imaging spectrum of tubercular involvement of abdominal lymph nodes, peritoneum, solid abdominal viscera, and the gastrointestinal tract. Tubercular lymphadenitis is the most frequent manifestation of abdominal tuberculosis and may show necrosis. Peritoneal tuberculosis is the next most commonly involved site in the abdomen and can be of wet, fibrotic, and dry forms. The ileocecal region is the most common site of involvement in gastrointestinal tuberculosis. Solid visceral involvement mostly affects the liver and spleen causing hepatosplenomegaly with a micronodular or macronodular imaging pattern. Awareness of the spectrum of imaging manifestations and a high index of suspicion is required to reach the correct diagnosis.
Keywords
abdominal tuberculosis - peritoneal tuberculosis - intestinal tuberculosis - hepatosplenic tuberculosis - computed tomography - ultrasound - barium studies - enterographyIntroduction
Tuberculosis (TB) is a global health problem and a leading cause of death due to a single infectious agent. As per the World Health Organization's global TB report of 2023, there were 7.5 million newly diagnosed cases and an estimated 1.3 million deaths due to the disease in 2022. India has the highest burden of TB, accounting for 27% of all patients.[1] Although an infection that mostly affects the lungs, extrapulmonary disease accounts for 10 to 12% of all cases, and abdominal involvement occurs in 11 to 16% of cases of extrapulmonary TB.[2]
Abdominal TB has a varied clinical presentation. Paustian's criteria for the diagnosis of abdominal TB (1964) were based on histological or culture demonstration of Mycobacterium tuberculosis bacteria. However, due to the paucibacillary nature of abdominal TB, these criteria are difficult to fulfill. Logan's modification of Paustian's criteria is often followed since it allows the diagnosis of abdominal TB based on a response to a trial of antitubercular treatment (ATT).[3] This approach has its drawbacks as well, since many other diseases may be wrongly treated with ATT, and to add to the confusion, few of the nontubercular diseases may show some response as well. Subsequently in a study, it was shown that clinical response coupled with mucosal response is diagnostic of intestinal TB in this setting and especially to differentiate from Crohn's disease.[4] Thereafter, it was observed that patients with intestinal TB often show a response by 8 to 12 weeks; hence, in cases of diagnostic dilemma, an assessment 2 to 3 months after the institution of ATT trial helps in diagnosis.[5] Even after the advent of newer molecular-based laboratory tests with high diagnostic accuracy such as GeneXpert and polymerase chain reaction, imaging plays a key role in the diagnosis of abdominal TB.
The purpose of this article is to review and illustrate the imaging manifestations of tubercular involvement of various abdominal organs including tubercular lymphadenitis, peritonitis, tubercular involvement of the hepatobiliary system, pancreas, spleen, adrenal glands, and gastrointestinal tract. The salient imaging features of tubercular involvement of different abdominal organs are summarized in [Table 1], whereas their important differential diagnoses are enlisted in [Table 2]. Although abdominal TB can involve the genitourinary system also, that is beyond the scope of this article.
Abbreviation: MRCP, magnetic resonance cholangiopancreatography.
Tubercular Lymphadenitis
Lymph nodal involvement is present in approximately two-thirds of patients and is the most frequent manifestation of abdominal TB.[6] Dissemination of tubercular infection to the abdominal nodes is usually by lymphatic route from the bowel. Since TB has a predilection for the terminal ileum, ileocecal junction, and right colon; the mesenteric, periportal, peripancreatic, and upper paraaortic nodal stations are commonly involved, whereas retroperitoneal lymph nodes below the level of renal hilum are unusual. Other routes of spread of infection to abdominal nodes are via the hematogenous route or by contiguous spread from other affected organs.[7]
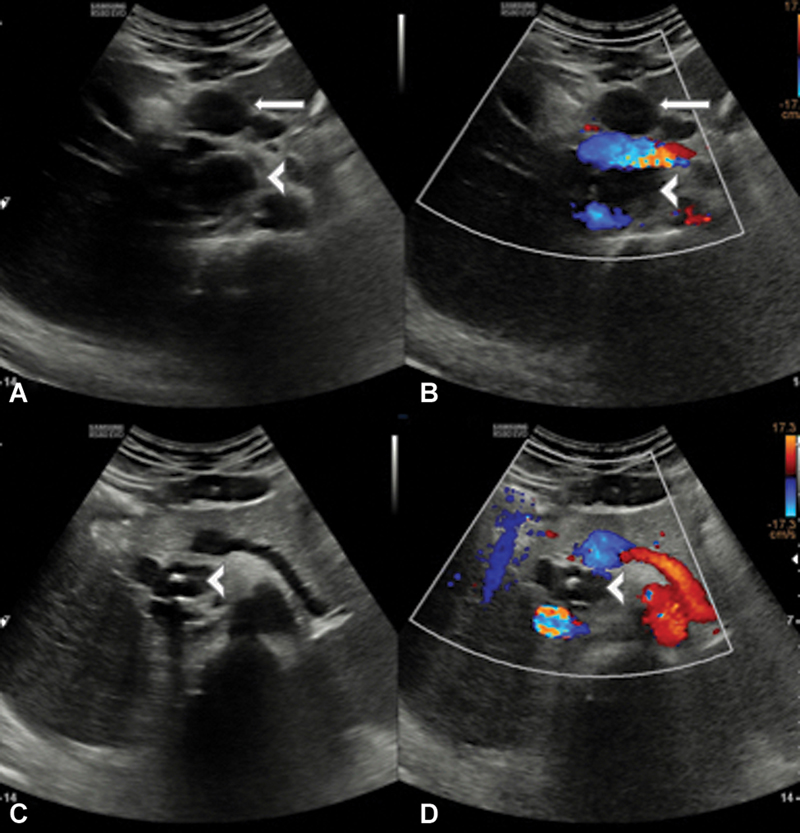
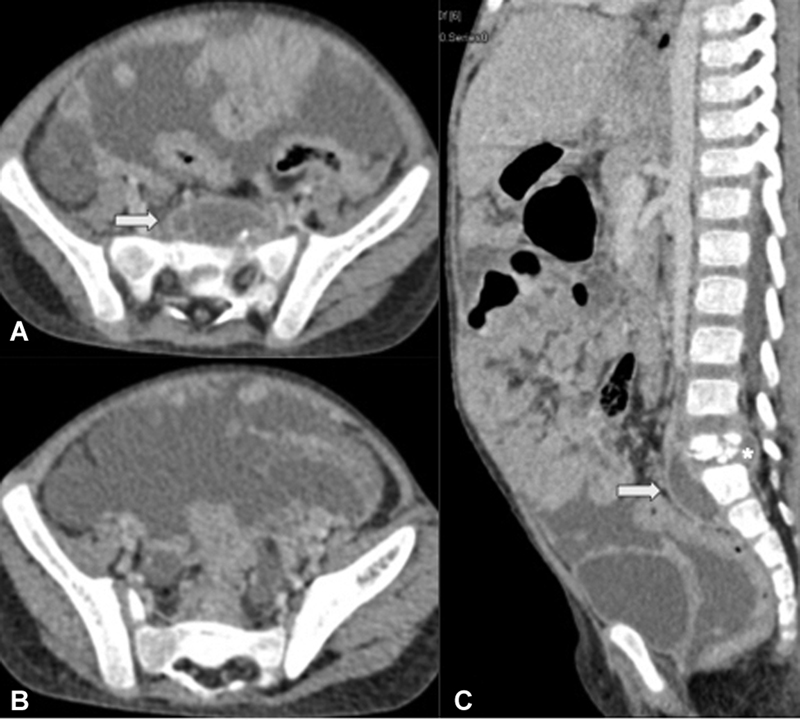
Histologically, tubercular nodes show initial lymphoid hyperplasia, followed by caseation necrosis, and eventually healing with fibrosis and calcification.[8] Corresponding to these pathological stages, the nodes may appear homogeneous in the initial stage. Subsequently, they develop liquefactive necrosis, which appears as marked central hypoechogenicity on ultrasound ([Fig. 1]), rim enhancement or heterogeneous enhancement on computed tomography (CT) or magnetic resonance imaging (MRI), and central T2 hyperintensity on MRI. Finally, the lymph nodes regress in size and may calcify.[7] [9] Tubercular lymphadenitis may also appear as an increase in the number of mesenteric nodes (>3 in a CT section), or as conglomerate nodal masses, with perinodal fat stranding and T2 hyperintensity due to periadenitis.[7] [10] The involvement of two or more lymphatic chains with poorly enhancing nodes is another pattern of tubercular lymphadenitis seen in patients with HIV/AIDS, possibly due to a weakened immune response[11] [12] ([Fig. 2]). Tubercular nodes can cause thrombosis of adjacent venous channels, especially the portal vein giving rise to cavernoma formation.[9]

Although quite characteristic, necrotic abdominal lymphadenopathy is not pathognomonic for tubercular lymphadenitis. It can also be seen in certain lymph nodal metastases, aggressive lymphoma, and inflammatory conditions such as Whipple's disease. The clinical context, characteristic distribution of nodes, and any concomitant peritoneal and intestinal changes are useful in differentiating tuberculous lymphadenitis from these conditions.[13] Ultrasound or CT-guided sampling of the enlarged abdominal lymph nodes can also aid in confirming the diagnosis.
Peritoneal Tuberculosis
Peritoneal involvement is the second most common site in abdominal TB. It can occur by hematogenous spread or from direct spread from other involved abdominal organs such as lymph nodes, bowel, or fallopian tubes.[9]
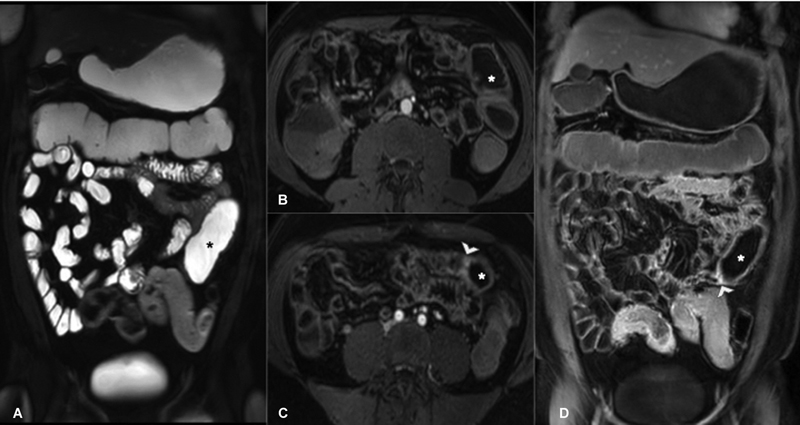
Classically, tubercular peritonitis has been considered to be of three types: wet, fibrotic, and dry. The wet type, in which ascites is the dominant feature, accounts for most cases of tubercular peritonitis ([Fig. 3]). Fibrotic or fixed type is characterized by omental and mesenteric thickening with matted bowel loops and sometimes loculated ascites ([Fig. 4]). The dry or plastic type is the least common form and is characterized by caseous nodules and dense adhesions. These three types frequently occur in combination as well.[14]
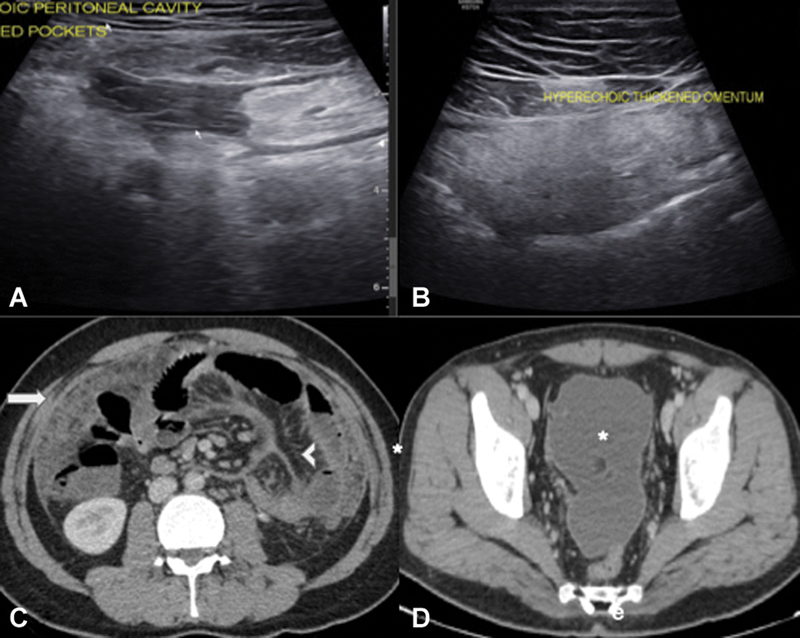
Ascites is the most common manifestation of tubercular peritonitis present in 30 to 100% of cases. It may be free or loculated; septae within the ascitic fluid are best demonstrated on ultrasound. Due to its exudative nature, the ascitic fluid is characteristically of high density (20–45 HU) on CT and shows delayed enhancement 15 to 20 minutes after contrast administration on MRI. Ascitic fluid examination shows low serum ascites albumin gradient (<1.1 g/dL), lymphocytosis, and elevated adenosine deaminase (>39 U/L). There may be associated peritoneal thickening (2–6 mm), which usually shows smooth enhancement, although occasionally peritoneal nodules (<5 mm) can also be seen. Omental involvement in tubercular peritonitis typically has a smudged appearance, implying infiltration with poorly defined lesions. Mesenteric involvement can be in the form of thickened mesenteric leaves, radiating thickened mesentery with a “stellate” configuration, mesenteric micronodules (<5 mm) or macronodules (>5 mm), and concomitant mesenteric lymphadenopathy or abscesses[8] [11] ([Fig. 5]).

Differential diagnosis of tubercular peritonitis includes peritoneal carcinomatosis, mesothelioma, and nontubercular peritonitis. In peritoneal carcinomatosis and mesothelioma, the peritoneal and omental thickening is nodular compared with relatively smooth peritoneal thickening and smudged omentum in tubercular peritonitis. Additionally, ascitic volume is disproportionately small in mesothelioma.[8] In a study by Ha et al, preservation of the omental line, mesenteric involvement with macronodules, necrotic or calcified lymphadenopathy, and concomitant splenic involvement also favored the diagnosis of tubercular peritonitis over carcinomatosis.[15] [16] Eventually, the diagnosis may depend upon ascitic fluid examination and/or peritoneal biopsy.
In advanced stages, the fibrotic type of tubercular peritonitis can progress to the formation of an abdominal cocoon (encapsulating peritoneal sclerosis). In this condition, there is encapsulation of small bowel loops in a thick fibrous membrane, leading to recurrent episodes of subacute intestinal obstruction. On barium meal follow-through studies, this appears as a clumping of dilated small bowel loops in a concertina-like configuration. The encapsulating membrane can also be visualized over the clumped bowel loops on high-resolution ultrasonography, CT, or MRI ([Fig. 6]). Encapsulating peritoneal sclerosis is not always of tubercular etiology. It can also be idiopathic or secondary to long-term peritoneal dialysis, β-blockers, sarcoidosis, systemic lupus erythematosus, abdominal surgery, or malignancy. However, interloop adhesions are more common in tuberculous abdominal cocoons, which appear on CT as angulation and kinking of the encapsulated bowel loops. Findings of necrotic abdominal lymphadenopathy and omental thickening with nodularity due to serosal tubercles are additional pointers on imaging indicative of a tuberculous cause. Internal hernias may also mimic an abdominal cocoon; however, the clustered bowel loops in internal hernias lack the overlying enhancing peritoneal membrane characteristic of an abdominal cocoon.[17]

Gastrointestinal Tuberculosis
Gastrointestinal TB usually occurs following the swallowing of infected sputum, ingestion of contaminated milk, hematogenous origin, or spread from contiguous organs. It can involve any part of the gastrointestinal tract but has a propensity to involve the ileocecal region, which accounts for 90% of the cases.[18] Clinically, patients present with abdominal pain, diarrhea, weight loss, and fever.[19] Morphologically, gastrointestinal TB may be of three forms: ulcerative, hypertrophic, or ulcerohypertrophic. The ulcerative form is characterized by multiple small transverse ulcers. In the hypertrophic form, there is a pseudonodular appearance that can mimic malignancy. The ulcerohypertrophic form is a result of transverse ulceration with intervening mucosal nodularity giving rise to a “cobblestone” appearance.[11]
Ileocecal Tuberculosis
The ileocecal region is the most frequent site of involvement (90% of cases) in gastrointestinal TB due to an abundance of lymphoid tissue and physiological intestinal stasis in this segment.[20] On ultrasound, concentric bowel wall thickening can be detected in the ileocecal region; when marked, it results in a pseudokidney appearance. In a retrospective study on the findings of intestinal TB on contrast-enhanced ultrasound, two patterns of enhancement were described by Yang et al: type 1 enhancement (13%) in which there was early serosal enhancement followed by gradual mucosal enhancement and type 2 enhancement (87%) in which the full thickness of the involved bowel showed early enhancement compared with normal bowel ([Fig. 7]). Additionally, they categorized the enhancement of thickened bowel wall as homogeneous or heterogeneous; the heterogeneous enhancement pattern correlated with the presence of caseous necrosis in the intestinal muscle layer on histopathology.[21]

Traditionally, barium meal follow-through was performed in patients with suspected intestinal TB, which may show spasm or hypermotility of the ileocecal valve in the early stages of the disease. Subsequently, there can be nonspecific inflammatory changes in the form of mucosal fold thickening, luminal narrowing, and irregularity of the ileocecal region. Various classical signs of intestinal TB may be seen such as Fleishner's or inverted umbrella sign (thickening of ileocecal valve lips with wide gaping and narrowed terminal ileum), Stierlin's sign (rapid emptying of cecum due to irritable mucosa), gooseneck deformity (pulled-up cecum with obtuse angulation of ileocecal junction and dilated terminal ileum), and string sign (fibrotic narrowing of terminal narrowing) ([Fig. 8]).[2] However, barium studies have been largely given up as they are low-yield, high-dose studies and have been replaced by cross-sectional enterography.[22]

Nowadays, CT enterography is widely employed for the evaluation of various intestinal diseases. Its main advantage over barium meal follow-through is its ability to concurrently demonstrate luminal, mural, and extraluminal features of intestinal TB.[23] Magnetic resonance (MR) enterography is a useful adjunct and its use is mostly limited to patients undergoing repeated imaging to obviate exposure to ionizing radiation. Findings of active ileocecal TB on CT or MR enterography include concentric symmetric mural thickening involving the terminal ileum, ileocecal junction, or cecum. The thickened bowel wall mostly shows homogeneous enhancement; less commonly stratified mural enhancement can be seen. Additionally, extraintestinal findings of abdominal TB such as necrotic mesenteric lymphadenitis, peritoneal, or hepatosplenic TB may be detected ([Fig. 9]). In the chronic inactive stage, there is stricture formation that appears as hypoenhancing bowel wall thickening with upstream bowel dilatation; enteroliths may also be present in the dilated bowel. Commonly encountered complications of intestinal TB are obstruction and perforation; less commonly, the formation of abscesses and fistulae can occur.[2] [23] [24]

Findings of active or inactive pulmonary TB are detected in up to 15% of patients with intestinal TB on chest radiographs.[25] A contrast-enhanced CT scan of the thorax can further aid in the diagnosis of intestinal TB; as a recent study found features of concomitant active pulmonary TB such as centrilobular/miliary nodules, consolidation, thick-walled cavitary lesions, necrotic mediastinal lymphadenopathy in 38% of patients with intestinal TB.[26] Therefore, a thoracic CT should be concomitantly performed when there is high suspicion of intestinal TB.
The chief differential diagnosis of ileocecal TB is Crohn's disease; the radiological, endoscopic, and histopathological features for differentiating the two entities are summarized in [Table 3].[2] [27] [28] Other differentials of ileocecal TB include infections such as amebiasis, Salmonella enteritis, and Yersinia enterocolitis, as well as neoplasms such as lymphoma and cecal carcinoma.
Abbreviation: VF/SC, visceral fat/subcutaneous fat.
Esophageal Tuberculosis
Esophageal TB accounts for approximately 2.8% of cases of gastrointestinal TB.[29] Primary esophageal TB is uncommon due to innate protection conferred by stratified squamous epithelial lining, esophageal peristalsis, and salivary enzymes. Esophageal TB usually occurs secondary to mediastinal, pulmonary, or spinal TB.[30] Patients clinically present with dysphagia, odynophagia, retrosternal pain, hematemesis, and constitutional symptoms.
The most frequent site of involvement is the middle third of the esophagus due to its proximity to the mediastinal nodes. On barium swallow, there can be extrinsic compression over the esophagus, strictures, formation of traction diverticula, sinus tracts or fistula, or a pseudotumor appearance. CT reveals nonspecific esophageal wall thickening ([Fig. 10]). However, concomitant pulmonary parenchymal abnormalities or mediastinal lymphadenopathy may aid in the diagnosis.[31] Carcinoma of the esophagus and Crohn's disease are two close imaging differentials.

Gastric Tuberculosis
Primary gastric TB is rare accounting for only 0.4 to 2% of cases of gastrointestinal TB; this is because of the acidic environment, lack of gastric lymphoid tissue, and relatively thick gastric mucosal lining.[32] Secondary gastric involvement is mostly associated with hematogenous spread from pulmonary infection or retrograde lymphatic spread from other abdominal organs. Patients may present with pain epigastrium, loss of weight, nausea, vomiting, hematemesis, or gastric outlet obstruction.[33]
The gastric antrum and distal body are the most commonly involved parts. Ulcerative lesion of the lesser curvature and pylorus is the most common morphological pattern of gastric TB, which can mimic peptic ulcer disease. Less commonly, it may present as hypertrophic form (resembling gastric malignancy or pyloric stenosis) or miliary lesions.[12] Adjacent lymphadenitis is often seen ([Figs. 11], [12]). Rarely, gastric TB causes sinus tracts and fistula formation.[34]


Duodenal Tuberculosis
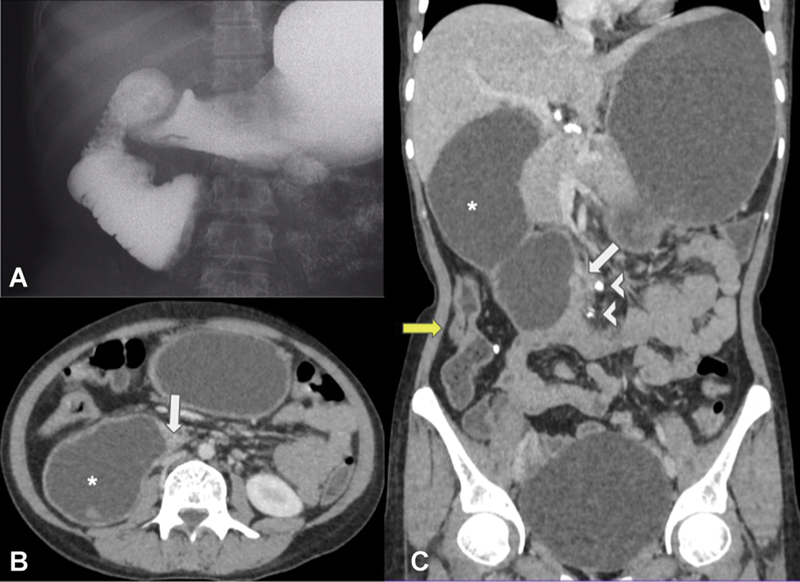
Duodenal TB also accounts for 2% of cases of gastrointestinal TB.[35] The majority of patients present with obstructive symptoms, whereas 10 to 20% of patients have dyspeptic symptoms. Duodenal involvement in TB may be intrinsic (ulcerative, hypertrophic, or ulcerohypertrophic form) or extrinsic (compression of the duodenum by periduodenal nodes).[36] In patients with obstructive symptoms, radiological findings include duodenal wall thickening with strictures or polypoid masses in cases of intrinsic duodenal TB, whereas widening of duodenal C-loop with luminal narrowing and periduodenal lymphadenopathy is seen in cases of extrinsic duodenal involvement. The third part of the duodenum is a common site of obstruction in duodenal TB, and its imaging appearance may resemble superior mesenteric artery syndrome ([Fig. 13]). In patients with dyspeptic symptoms, duodenal ulcers are frequently encountered[37] ([Fig. 14]). Occasionally, the biliary system can be secondarily involved with biliary dilatation or the formation of choledochoduodenal fistula.[38] Upper gastrointestinal Crohn's disease and neoplasia are the important differentials of duodenal TB.

Jejunal or Ileal Tuberculosis
Isolated involvement of jejunum or ileum occurs less frequently as compared with ileocecal TB. Imaging findings are nonspecific and comprise ulcers, mucosal fold thickening and strictures on barium meal follow-through, and bowel wall thickening on CT or MRI[8] [11] ([Figs. 15], [16]).

Colorectal Tuberculosis
Isolated large bowel involvement is seen in nearly 10% of cases of gastrointestinal TB.[39] Patients usually present with colicky abdominal pain, diarrhea, and weight loss. The ascending colon and transverse colon are the most commonly involved sites. Multifocal involvement can also be present.[39] [40] On imaging, there is spasm, increased motility, thickened mucosal folds, and aphthous ulcerations in the early stages of the disease. In advanced cases, there is transverse or circumferential ulceration, mucosal nodularity, inflammatory polyps, strictures with luminal narrowing ([Fig. 17]), and hypertrophic masses mimicking adenocarcinoma of the colon.[41] The other differentials of colonic TB are inflammatory bowel disease, amebic colitis, pseudomembranous colitis, and ischemic colitis.

Anoperineal Tuberculosis
Anoperineal TB is rare, accounting for less than 1% of cases of gastrointestinal TB.[42] Patients present with perianal pain, discharge, hematochezia, or constipation, frequently accompanied by constitutional symptoms. Morphologically, anoperineal TB can appear as fistula-in-ano, anal ulcerations (multiple in miliary disease), short annular strictures, lupoid form (submucosal nodule with overlying ulceration), and verrucous form (wart-like).[43] On imaging, the most common finding is a perianal fistula ([Fig. 18]). Simple intersphincteric fistulas are the most frequently encountered type of anal TB.[44] However, the presence of nonhealing or recurrent fistula, complex fistula, suprasphincteric and transsphincteric type of fistula, underlying anorectal thickening, associated inguinal or pelvic lymphadenopathy, and occasionally evidence of osteomyelitis of pelvic bones should alert the radiologist to the possibility of underlying anal TB. The chief differentials of anoperineal TB include cryptoglandular fistula, Crohn's disease, pelvic actinomycosis, and lymphogranuloma venereum.[42]

Complications of Gastrointestinal Tuberculosis
In patients with gastrointestinal TB, serious complications such as intestinal obstruction, perforation or gastrointestinal hemorrhage, formation of abscesses and fistula, and malabsorption may ensue ([Table 4]). Obstruction is the most common complication (12–60% of cases), which can occur due to hyperplastic bowel wall thickening, strictures, or adhesions.[45] On imaging, dilated bowel loops (caliber of small bowel > 3 cm and/or large bowel > 6 cm) are visualized ([Fig. 19]).
Abbreviation: CT, computed tomography.

Perforation occurs in 1 to 10% of cases of intestinal TB, usually seen in patients with severe disease, and is associated with a high mortality rate. In India, TB is one of the leading causes of small bowel perforation, second only to enteric fever.[32] Peritoneal involvement in TB with reactive thickening and adhesion formation likely reduces the incidence of perforations in intestinal TB. Tubercular perforations are solitary in the vast majority of cases (90%), with ileum being the most common site. The perforations usually occur due to pressure necrosis in the segment of the intestine proximal to a stricture ([Fig. 20]). Perforations may be free or localized. CT is much more sensitive than radiographs in detecting perforation and can demonstrate it in 81% of cases.[46] Ultrasound can reveal fluid collections with extraluminal air foci around the thickened diseased bowel. Rather than primary repair, these patients require resection of the affected bowel segment with primary anastomosis or exteriorization.[47]

Intraperitoneal tuberculous abscess is an uncommon complication that appears on CT as a rim-enhancing multiseptated hypodense mass. These may form due to the conglomeration of necrotic nodes or due to the encapsulation of intraperitoneal caseous fluid between the bowel, solid abdominal viscera, and peritoneum. Both forms of tuberculous abscesses are associated with necrotic abdominal lymphadenopathy. However, the nodal abscesses are close to other enlarged necrotic nodes, whereas encapsulated abscesses are located at sites remote from the necrotic nodes.[48] Large abscesses may require percutaneous drainage. Although more common in Crohn's disease, patients with abdominal TB may also present occasionally with enterocutaneous ([Fig. 21]), enteroenteric, enterovesical, and perianal fistula.[49] [50] [51]

Gastrointestinal hemorrhage is a relatively infrequent complication of intestinal TB and is rarely massive. Hemorrhage is usually due to mucosal ulceration and occasionally due to mesenteric pseudoaneurysm formation due to tuberculous vasculitis. The ileocecal region is the most common site of bleed. If the hemorrhage is not controlled medically and endoscopically, these patients require resection of the culprit segment in conjunction with ATT. Angiographic intervention may be contemplated in case of active contrast extravasation or pseudoaneurysm.[52]
Malabsorption syndrome can occur due to stasis from intestinal strictures or due to extensive mucosal involvement. In the former case, dilated bowel loops proximal to a stricture are visualized, whereas in the latter case, there can be radiological evidence of extensive mucosal fold thickening.[45]
Solid Organ Tuberculosis
Hepatosplenic Tuberculosis
Hepatosplenic involvement is usually secondary to pulmonary or miliary TB and has been found on postmortem evaluation in 80 to 100% cases of disseminated TB.[14] Dissemination of tubercle bacilli to the liver and spleen is by hematogenous route in these cases and results in a micronodular pattern on imaging. This manifests as hepatosplenomegaly with diffuse parenchymal hyperechogenicity (“bright liver and spleen'' appearance) on ultrasound. Hypoechoic miliary nodules of 0.5 to 2 mm can also be visualized on high-resolution ultrasonography. These nodules may appear as tiny hypodense lesions on CT. Alternatively, if the lesion size is less than the resolving power of CT, only hepatosplenomegaly with homogenous or heterogenous parenchymal enhancement may be apparent.[11] In the chronic stage, calcified nodules are seen. The differential diagnosis for this form of hepatosplenic TB includes miliary metastases, lymphoma, and other granulomatous disorders such as sarcoidosis and fungal infections.[20]
Less commonly, in approximately 20% of cases, hepatosplenic TB occurs by dissemination through the portal vein, which results in a macronodular imaging pattern due to tuberculomas or tubercular abscess formation.[9] This is characterized by single or multiple lesions of 1- to 3-cm size, which are typically hypoechoic on ultrasound but maybe hyperechoic in earlier stages before the onset of caseous necrosis. The lesions are hypodense on CT with no or minimal peripheral enhancement. The central hypodense part is on account of the caseous necrosis, whereas the peripheral rim is due to the granulomatous inflammatory response. Conglomeration of the lesions can give a honeycomb appearance ([Fig. 22]). On MRI, the lesions are hypointense on T1-weighted sequences, hyperintense with an intermediate signal intensity rim on T2W sequences and show diffusion restriction and peripheral enhancement. Like tuberculomas elsewhere, the macronodular form of hepatosplenic TB can also be hypointense on T2W sequences.[53] Portal vein thrombosis and portal hypertension have been infrequently reported in association with the macronodular form of hepatic TB.[54] Micronodular and macronodular lesions can also occur simultaneously in the same patient giving rise to a mixed pattern. The differential diagnosis for the macronodular form of hepatosplenic TB includes metastases, abscesses, and primary malignancies.[34]

Serohepatic type is the rarest form of hepatic TB. This is characterized by multiple hypodense subcapsular lesions without significant enhancement on CT ([Fig. 23]). The subcapsular lesions appear hypointense on T1W sequences and hyperintense on T2W sequences with subtle peripheral enhancement. This morphological pattern is known as the “frosted liver” appearance.[55] [56] Serohepatic TB should be considered in the differential diagnosis of lesions causing scalloping of liver outline, along with other conditions such as pseudomyxoma peritonei, peritoneal carcinomatosis, and lymphomatosis.[57]

Pancreatic Tuberculosis
Isolated pancreatic involvement in TB is quite rare. On imaging, it manifests as a focal pancreatic mass or less commonly as diffuse pancreatic enlargement. The focal form of pancreatic TB has a predilection for the head of the pancreas and appears as a hypoechoic solid or complex cystic mass on ultrasound.[58] On CT, it appears as a hypodense solid or solid cystic lesion, which is hypoenhancing to the normal pancreatic parenchyma[59] ([Fig. 24]). On MRI, it appears as a heterogeneously enhancing mass, which is hypointense on T1W and of heterogeneous signal intensity on T2W sequences. In the diffuse form of pancreatic TB, a bulky pancreas with heterogeneous enhancement is seen on CT and MRI. Diffuse narrowing of the main pancreatic duct may also be present in magnetic resonance cholangiopancreatography (MRCP).[60]

The focal form of pancreatic TB mimics pancreatic ductal adenocarcinoma or pancreatic cystic neoplasms, especially if vascular involvement and necrotic peripancreatic lymphadenopathy are present. However, unlike pancreatic ductal adenocarcinoma, upstream dilatation of the main pancreatic duct and common bile duct are uncommon in pancreatic TB. The presence of punctate or coarse calcific foci within the lesions also favors a diagnosis of TB over adenocarcinoma.[59] The differential diagnoses for the diffuse form of pancreatic TB include acute pancreatitis, autoimmune pancreatitis, and pancreatic lymphoma.[60] It is difficult to diagnose pancreatic TB in the absence of concomitant involvement of other sites such as bowel or peritoneum, and pancreatic ductal adenocarcinoma remains the first diagnosis of a focal pancreatic mass. Therefore, endoscopic ultrasound-guided fine-needle aspiration cytology is essential to clinch the diagnosis of pancreatic TB and rule out malignancy.
Tuberculosis of the Gallbladder and Biliary Tree
TB of the gallbladder is rarely encountered, as the wall of the gallbladder is relatively resistant to M. tuberculosis, and the alkaline nature of bile also inhibits its growth.[12] [61] On CT, three patterns of involvement have been described by Xu et al. Most commonly, gallbladder TB presents as diffuse thickening of the gallbladder wall. Less frequently, it appears mass like or polypoidal.[62] Thus, gallbladder TB mimics cholecystitis or carcinoma of the gallbladder. Diagnosis is usually made on histopathological examination of cholecystectomy specimens rather than on imaging.[63]
Tubercular involvement of the biliary tree has an estimated annual incidence of 0.1%.[64] Biliary tree involvement is usually secondary to extrinsic compression of bile ducts by enlarged periportal nodes or hepatic granulomas. Less commonly, tubercular cholangitis occurs, which is characterized by multifocal strictures of intrahepatic bile ducts; involvement of extrahepatic bile duct is rare.[53] The strictures can lead to intrahepatic biliary radicle dilatation and parenchymal atrophy mimicking cholangiocarcinoma. A beaded pattern with alternating strictures and dilatation may also be seen on MRCP; this resembles primary sclerosing cholangitis or IgG4-related cholangiopathy.[20]
Adrenal Tuberculosis
Adrenal glands are the most commonly involved endocrine glands in extrapulmonary TB. Patients may present with adrenocortical insufficiency (Addison's disease) if more than 90% of the gland is affected.[65] The involvement is bilateral in majority of cases due to hematogenous route of spread of infection. In the initial stages of the disease, approximately half the patients may have mass-like enlargement of adrenals, whereas the remainder have enlarged adrenals with preserved triangular glandular contour.[66] Caseous necrosis accounts for the characteristic rim (±septal) enhancement on CT, and central isointense to hypointense signal on T2W images with peripheral enhancement on MRI ([Fig. 25]). In chronic stages, glandular atrophy with calcification ensues.[67] Differential diagnosis of adrenal TB includes other disease entities with bilateral adrenal involvement such as metastases, lymphoma and histoplasmosis.[68] T2 hypointensity and mild or peripheral contrast enhancement with preserved gland shape may be seen in both TB and histoplasmosis; round mass-like enlargement is more in favor of lymphoma. Metastases usually appear as discrete heterogeneously enhancing T2 hyperintense nodules.

Assessment of Response to Antitubercular Treatment
Standard treatment of abdominal TB requires a 6- to 12-month course of ATT. Even when the diagnosis is not reliably established, patients with a high suspicion of abdominal TB are given a therapeutic trial of ATT, following which clinical (based on symptomatology and inflammatory markers such as erythrocyte sedimentation rate, C-reactive protein) and endoscopic responses are assessed periodically. Although patients with TB and Crohn's disease may both show clinical response at 3 months, this response is not sustained in Crohn's disease. Also, mucosal healing on endoscopy would occur after therapeutic ATT trial in nearly all patients with intestinal TB but in less than 5% of patients with Crohn's disease.[4] [69] It has been shown that patients eventually diagnosed to have Crohn's disease but given ATT trial earlier due to diagnostic dilemma had a higher chance of developing stricturing disease and higher surgical rates; hence, the clinical and mucosal response to ATT trial should be assessed at 8 to 12 weeks in such settings when there is diagnostic confusion.[5]
Imaging by CT enterography or ultrasound can also be used to assess response to ATT. In a retrospective study, Ma et al classified response to ATT on these modalities as a “good response” if the lesion area decreased by over 50% or if the lesion area decreased by less than 50% accompanied by reduced bowel wall thickening and enhancement. They found excellent agreement between ultrasound and colonoscopy (κ-value 1) and good agreement between CT enterography and colonoscopy (κ-value 0.643) in assessing response to ATT.[70]
Bowel wall thickening, abdominal lymphadenopathy, and ascites usually regress with ATT. Calcification in nodes and visceral granulomas is also a sign of healing. Fibrosis can lead to contracted and pulled-up cecum ([Fig. 26]) and stricture formation. However, bowel wall thickening, homogeneous wall enhancement, and lymphadenopathy can persist post-ATT, and these do not necessarily indicate active disease.[71] In fact, tubercular strictures, especially colonic ones, are particularly resilient to ATT, with response seen in only a quarter to two-thirds of patients.[72] [73] Therefore, rather than relying on imaging findings alone, the decision to continue or stop ATT should be made in conjunction with clinical and endoscopic evidence of disease activity.

More recently, perfusion CT and MRI with diffusion-weighted imaging have been applied in assessment of response to ATT. In one study, it was found that there is a reduction in intestinal mean blood flow, blood volume, and maximum peak intensity along with an increase in mean transit time and time to peak on perfusion CT following a course of ATT, likely due to reduced bowel inflammation.[74] Another study found that patients with good response to ATT showed an increase in mean apparent diffusion coefficient (ADC) values from 1.1 ± 0.37 × 10⁻³ to 2.1 ± 0.64 × 10⁻³ mm2/s after completion of treatment.[75] Thus, CT perfusion indices and ADC values could serve as objective measures of response to ATT.
Functional imaging with 18F-fluorodeoxyglucose positron emission tomography/CT can be useful in monitoring the response to ATT. While anatomical imaging may reveal persistent findings of abdominal TB, the maximal standardized uptake value (SUVmax) of initially FDG-avid tubercular lesions reduces to undetectable levels on follow-up in case of good therapeutic response and may indicate treatment endpoint. On the other hand, persistent uptake suggests disease is still active and may require prolongation or modification of ATT.[76]
Role of Tissue Diagnosis
Confirmation of diagnosis of abdominal TB requires histological demonstration of caseous granulomas and/or microbiological demonstration of tubercle bacilli. In case of peritoneal TB, diagnostic paracentesis is usually performed. There is low sensitivity for the detection of acid-fast bacilli (AFB) in ascitic fluid smears (3%). However, microbiological culture or GeneXpert test (sensitivity 35 and 30%, respectively) can also be performed on ascitic fluid.[77] In case of low-volume ascites, ultrasound can guide the sampling of the fluid.
For mesenteric lymph nodal or hepatosplenic TB, percutaneous ultrasound-guided sampling can be performed (sensitivity 78.6 and 87.5%, respectively).[78] CT guidance may be required for sampling of retroperitoneal nodes, whereas endoscopic-ultrasound guided sampling is preferred for locations that are difficult to access percutaneously (pancreaticoduodenal region). For gastrointestinal TB, endoscopic sampling is done; although imaging can guide the gastroenterologist regarding the sites of the affected bowel. Here also, AFB staining has low sensitivity (<5%) compared with mycobacterial culture (40%) and GeneXpert (23%).[77]
Conclusion
In conclusion, abdominal TB has a myriad of imaging manifestations, and radiologists need to be cognizant of them. Although no single radiological feature can be considered pathognomonic, the constellation of findings in different abdominal organs, as well as concomitant features of pulmonary TB or other sites of extrapulmonary TB, can help in arriving at the diagnosis. Imaging can also guide in selecting the best route for sampling the affected organ for histological or microbiological confirmation of the diagnosis. Ileocolonoscopy plays an important role in evaluating the mucosal abnormalities and in documenting healing after ATT.
Conflict of Interest
None declared.
-
References
- 1 World Health Organization. Global Tuberculosis report 2023. Accessed February 11, 2024 at: https://iris.who.int/bitstream/handle/10665/373828/9789240083851-eng.pdf?sequence=1
- 2 Sharma R, Madhusudhan KS, Ahuja V. Intestinal tuberculosis versus Crohn's disease: clinical and radiological recommendations. Indian J Radiol Imaging 2016; 26 (02) 161-172
- 3 Mandavdhare HS, Singh H, Sharma V. Recent advances in the diagnosis and management of abdominal tuberculosis. EMJ Gastroenterol 2017; 6 (01) 52-60
- 4 Pratap Mouli V, Munot K, Ananthakrishnan A. et al. Endoscopic and clinical responses to anti-tubercular therapy can differentiate intestinal tuberculosis from Crohn's disease. Aliment Pharmacol Ther 2017; 45 (01) 27-36
- 5 Gupta A, Pratap Mouli V, Mohta S. et al. Antitubercular therapy given to differentiate Crohn's disease from intestinal tuberculosis predisposes to stricture formation. J Crohn's Colitis 2020; 14 (11) 1611-1618
- 6 Leder RA, Low VH. Tuberculosis of the abdomen. Radiol Clin North Am 1995; 33 (04) 691-705
- 7 De Backer AI, Mortelé KJ, Deeren D, Vanschoubroeck IJ, De Keulenaer BL. Abdominal tuberculous lymphadenopathy: MRI features. Eur Radiol 2005; 15 (10) 2104-2109
- 8 Vanhoenacker FM, De Backer AI, Op de BB. et al. Imaging of gastrointestinal and abdominal tuberculosis. Eur Radiol 2004; 14 (Suppl. 03) E103-E115
- 9 Ladumor H, Al-Mohannadi S, Ameerudeen FS, Ladumor S, Fadl S. TB or not TB: a comprehensive review of imaging manifestations of abdominal tuberculosis and its mimics. Clin Imaging 2021; 76: 130-143
- 10 Joshi AR, Basantani AS, Patel TC. Role of CT and MRI in abdominal tuberculosis. Curr Radiol Rep 2014; 2: 66
- 11 Akhan O, Pringot J. Imaging of abdominal tuberculosis. Eur Radiol 2002; 12 (02) 312-323
- 12 Suarez T, Garcia V, Estrada T, Acosta F. Imaging in abdominal tuberculosis. Rev Colomb Radiol. 2010; 21 (04) 1-11
- 13 Suri S, Gupta S, Suri R. Computed tomography in abdominal tuberculosis. Br J Radiol 1999; 72 (853) 92-98
- 14 Na-ChiangMai W, Pojchamarnwiputh S, Lertprasertsuke N, Chitapanarux T. CT findings of tuberculous peritonitis. Singapore Med J 2008; 49 (06) 488-491
- 15 Ha HK, Jung JI, Lee MS. et al. CT differentiation of tuberculous peritonitis and peritoneal carcinomatosis. AJR Am J Roentgenol 1996; 167 (03) 743-748
- 16 Pang Y, Li Y, Xu D, Sun X, Hou D. Differentiating peritoneal tuberculosis and peritoneal carcinomatosis based on a machine learning model with CT: a multicentre study. Abdom Radiol (NY) 2023; 48 (04) 1545-1553
- 17 Singhal M, Krishna S, Lal A. et al. Encapsulating peritoneal sclerosis: the abdominal cocoon. Radiographics 2019; 39 (01) 62-77
- 18 Balthazar EJ, Gordon R, Hulnick D. Ileocecal tuberculosis: CT and radiologic evaluation. AJR Am J Roentgenol 1990; 154 (03) 499-503
- 19 Sharma MP, Ahuja V. Abdominal (gastrointestinal tract) tuberculosis in adult. In: Schaaf HS, Zumla AI, Grange JM. eds. Tuberculosis: A Comprehensive Clinical Reference. Edinburgh: Saunders/Elsevier; 2009: 424-431
- 20 Gupta P, Kumar S, Sharma V. et al. Common and uncommon imaging features of abdominal tuberculosis. J Med Imaging Radiat Oncol 2019; 63 (03) 329-339
- 21 Yang G, Zhang W, Yu T. et al. The features of intestinal tuberculosis by contrast-enhanced ultrasound. Jpn J Radiol 2015; 33 (09) 577-584
- 22 Kalra N, Agrawal P, Mittal V. et al. Spectrum of imaging findings on MDCT enterography in patients with small bowel tuberculosis. Clin Radiol 2014; 69 (03) 315-322
- 23 Bhatt S, Roy S, Bhardwaj N. et al. Kaleidoscopic view of bowel tuberculosis on multi- detector computed tomography (CT) enterography - a novel technique unfolding an archaic disease. Pol J Radiol 2017; 82: 783-791
- 24 Krishna S, Kalra N, Singh P. et al. Small-bowel tuberculosis: a comparative study of MR enterography and small-bowel follow-through. AJR Am J Roentgenol 2016; 207 (03) 571-577
- 25 Sharma SK, Mohan A. Extrapulmonary tuberculosis. Indian J Med Res 2004; 120 (04) 316-353
- 26 Kedia S, Sharma R, Vuyyuru SK. et al. Addition of computed tomography chest increases the diagnosis rate in patients with suspected intestinal tuberculosis. Intest Res 2022; 20 (02) 184-191
- 27 Choudhury A, Dhillon J, Sekar A, Gupta P, Singh H, Sharma V. Differentiating gastrointestinal tuberculosis and Crohn's disease- a comprehensive review. BMC Gastroenterol 2023; 23 (01) 246
- 28 Kedia S, Madhusudhan KS, Sharma R. et al. Combination of increased visceral fat and long segment involvement: development and validation of an updated imaging marker for differentiating Crohn's disease from intestinal tuberculosis. J Gastroenterol Hepatol 2018; 33 (06) 1234-1241
- 29 Khan MS, Maan MHA, Sohail AH, Memon WA. Primary esophageal tuberculosis mimicking esophageal carcinoma on computed tomography: a case report. World J Gastrointest Surg 2019; 11 (09) 373-380
- 30 Lee KH, Kim HJ, Kim KH, Kim HG. Esophageal tuberculosis manifesting as submucosal abscess. AJR Am J Roentgenol 2003; 180 (05) 1482-1483
- 31 Nagi B, Lal A, Kochhar R. et al. Imaging of esophageal tuberculosis: a review of 23 cases. Acta Radiol 2003; 44 (03) 329-333
- 32 Debi U, Ravisankar V, Prasad KK, Sinha SK, Sharma AK. Abdominal tuberculosis of the gastrointestinal tract: revisited. World J Gastroenterol 2014; 20 (40) 14831-14840
- 33 Padma V, Anand NN, Rajendran SM, Gurukal S. Primary tuberculosis of stomach. J Indian Med Assoc 2012; 110 (03) 187-188
- 34 Pereira JM, Madureira AJ, Vieira A, Ramos I. Abdominal tuberculosis: imaging features. Eur J Radiol 2005; 55 (02) 173-180
- 35 Bhatti A, Hussain M, Kumar D, Samo KA. Duodenal tuberculosis. J Coll Physicians Surg Pak 2012; 22 (02) 111-112
- 36 Dahiya D, Garg M, Kaman L, Rana S, Rao C, Behera A. Duodenal tuberculosis–a rare case report and review of literature. Pol Przegl Chir 2013; 85 (08) 464-466
- 37 Nagi B, Lal A, Gupta P, Kochhar R, Sinha SK. Radiological findings in duodenal tuberculosis: a 15-year experience. Abdom Imaging 2015; 40 (05) 1104-1109
- 38 Chavhan GE, Ramakantan R. Duodenal tuberculosis: radiological features on barium studies and their clinical correlation in 28 cases. J Postgrad Med 2003; 49 (03) 214-217
- 39 Nagi B, Kochhar R, Bhasin DK, Singh K. Colorectal tuberculosis. Eur Radiol 2003; 13 (08) 1907-1912
- 40 Mukewar S, Mukewar S, Ravi R, Prasad A. S Dua K, Colon tuberculosis: endoscopic features and prospective endoscopic follow-up after anti-tuberculosis treatment. Clin Transl Gastroenterol 2012; 3 (10) e24
- 41 Verma K, Pai VD, Patil PS, Bal M, Saklani AP. Isolated colorectal tuberculosis masquerading as malignancy: a case series. Trop Gastroenterol 2016; 37 (03) 227-230
- 42 Azadi A, Jafarpour Fard P, Sagharjoghi Farahani M, Khodadadi B, Almasian M. Anal tuberculosis: a non-healing anal lesion. IDCases 2018; 12: 25-28
- 43 Pandit K, Khanal S, Bhatta S, Trotter AB. Anorectal tuberculosis as a chronic rectal mass mimicking rectal prolapse in a child-a case report. Ann Med Surg (Lond) 2018; 36: 264-266
- 44 Choi YS, Kim DS, Lee JB. et al. Clinical features of tuberculous versus Crohn's anal fistulas, in Korea. J Crohn's Colitis 2015; 9 (12) 1132-1137
- 45 Makanjuola D, al Orainy I, al Rashid R, Murshid K. Radiological evaluation of complications of intestinal tuberculosis. Eur J Radiol 1998; 26 (03) 261-268
- 46 Coccolini F, Ansaloni L, Catena F, Lazzareschi D, Puviani L, Pinna AD. Tubercular bowel perforation: what to do?. Ulus Travma Acil Cerrahi Derg 2011; 17 (01) 66-74
- 47 Gayathre SP, Kudiyarasu, Kannan R, Shajini N. A rare complication of the great mimicker: free tubercular ileal perforation. Int Surg J 2021; 8 (04) 1366-1369
- 48 Dong P, Chen JJ, Wang XZ, Wang YQ. Intraperitoneal tuberculous abscess: computed tomography features. World J Radiol 2015; 7 (09) 286-293
- 49 Vetri R, Kannichamy V, Jacob VA, Sainath S. Abdominal tuberculosis presenting as an umbilical sinus: a case report. Cureus 2022; 14 (11) e31184
- 50 Singh H, Mandavdhare H, Sharma V. All that fistulises is not Crohn's disease: multiple entero-enteric fistulae in intestinal tuberculosis. Pol Przegl Chir 2019; 91 (01) 35-37
- 51 Wu P, Zeng J, Yang L. Case report: vesicorectal fistula caused by intestinal tuberculosis complicated with systemic lupus erythematosus. Infect Drug Resist 2022; 15: 6237-6243
- 52 Bavunoglu I, Ayan F, Karabicak I. et al. Selective jejunal artery pseudoaneurysm embolization in a patient with massive gastrointestinal bleeding due to intestinal tuberculosis. J Emerg Med 2006; 31 (04) 391-394
- 53 Karaosmanoglu AD, Onur MR, Sahani DV, Tabari A, Karcaaltincaba M. Hepatobiliary tuberculosis: imaging findings. AJR Am J Roentgenol 2016; 207 (04) 694-704
- 54 Venkatesh SK, Tan LK, Siew EP, Putti TC. Macronodular hepatic tuberculosis associated with portal vein thrombosis and portal hypertension. Australas Radiol 2005; 49 (04) 322-324
- 55 Yu RS, Zhang SZ, Wu JJ, Li RF. Imaging diagnosis of 12 patients with hepatic tuberculosis. World J Gastroenterol 2004; 10 (11) 1639-1642
- 56 Jain N, Rissam HK, Puri SK, Chauhan U. The “frosted liver” appearance in hepatic tuberculosis: a rare presentation. BJR Case Rep 2016; 2 (04) 20150367
- 57 Israrahmed A, Agarwal S, Singh S, Lal H. 'Frosted liver' appearance in serohepatic variant of hepatic tuberculosis. BMJ Case Rep 2021; 14 (03) e241643
- 58 Ray S, Das K, Mridha AR. Pancreatic and peripancreatic nodal tuberculosis in immunocompetent patients: report of three cases. JOP 2012; 13 (06) 667-670
- 59 Dou Y, Liang Z. Pancreatic tuberculosis: a computed tomography imaging review of thirteen cases. Radiol Infect Dis 2019; 6: 31-37
- 60 De Backer AI, Mortelé KJ, Bomans P, De Keulenaer BL, Vanschoubroeck IJ, Kockx MM. Tuberculosis of the pancreas: MRI features. AJR Am J Roentgenol 2005; 184 (01) 50-54
- 61 Gupta A, Gupta A, Anjum R, Agrawal S, Mallik D. A comprehensive review on primary gallbladder tuberculosis. Pol Przegl Chir 2018; 90 (02) 10-12
- 62 Xu XF, Yu RS, Qiu LL, Shen J, Dong F, Chen Y. Gallbladder tuberculosis: CT findings with histopathologic correlation. Korean J Radiol 2011; 12 (02) 196-202
- 63 Runner GJ, Corwin MT, Siewert B, Eisenberg RL. Gallbladder wall thickening. AJR Am J Roentgenol 2014; 202 (01) W1-W12
- 64 Kritika SR, Tiwari T, Goyal S. CT evaluation of different forms of abdominal tuberculosis: a series of multiple cases. Japanese J Gastroenterol Res. 2022; 2 (09) 1090
- 65 Naeem M, Zulfiqar M, Siddiqui MA. et al. Imaging manifestations of genitourinary tuberculosis. Radiographics 2021; 41 (04) 1123-1143
- 66 Guo YK, Yang ZG, Li Y. et al. Addison's disease due to adrenal tuberculosis: contrast-enhanced CT features and clinical duration correlation. Eur J Radiol 2007; 62 (01) 126-131
- 67 Zhang XC, Yang ZG, Li Y. et al. Addison's disease due to adrenal tuberculosis: MRI features. Abdom Imaging 2008; 33 (06) 689-694
- 68 Gupta S, Ansari MAM, Gupta AK, Chaudhary P, Bansal LK. Current approach for diagnosis and treatment of adrenal tuberculosis-our experience and review of literature. Surg J (NY) 2022; 8 (01) e92-e97
- 69 Kedia S, Das P, Madhusudhan KS. et al. Differentiating Crohn's disease from intestinal tuberculosis. World J Gastroenterol 2019; 25 (04) 418-432
- 70 Ma L, Zhu Q, Li Y. et al. The potential role of CT enterography and gastrointestinal ultrasound in the evaluation of anti-tubercular therapy response of intestinal tuberculosis: a retrospective study. BMC Gastroenterol 2019; 19 (01) 106
- 71 Rathi V, Yadav V, Deep BS, Bhatt S, Giri S. CT appearances in treated abdominal tuberculosis: a radiologist's dilemma. J Gastrointestinal Abdominal Radiol ISGAR 2022; 5: 30-36
- 72 Aggarwal P, Kedia S, Sharma R. et al. Tubercular intestinal strictures show a poor response to anti-tuberculous therapy. Dig Dis Sci 2017; 62 (10) 2847-2856
- 73 Jena A, Mohindra R, Rana K. et al. Frequency, outcomes, and need for intervention in stricturing gastrointestinal tuberculosis: a systematic review and meta-analysis. BMC Gastroenterol 2023; 23 (01) 46
- 74 Sasi A, Ahuja V, Das CJ. et al. Assessment of CT perfusion indices of the clinicoradiological response to anti-tubercular therapy in patients with intestinal tuberculosis. Clin Radiol 2023; 78 (12) e1081-e1086
- 75 Mathur P, Sharma R, Kandasamy D, Kedia S, Gamanagatti S, Ahuja V. Can ADC be used as a surrogate marker of response to therapy in intestinal tuberculosis?. Abdom Radiol (NY) 2019; 44 (09) 3006-3018
- 76 Tian G, Xiao Y, Chen B, Xia J, Guan H, Deng Q. FDG PET/CT for therapeutic response monitoring in multi-site non-respiratory tuberculosis. Acta Radiol 2010; 51 (09) 1002-1006
- 77 Jha DK, Pathiyil MM, Sharma V. Evidence-based approach to diagnosis and management of abdominal tuberculosis. Indian J Gastroenterol 2023; 42 (01) 17-31
- 78 Suri R, Gupta S, Gupta SK, Singh K, Suri S. Ultrasound guided fine needle aspiration cytology in abdominal tuberculosis. Br J Radiol 1998; 71 (847) 723-727
Address for correspondence
Publication History
Article published online:
31 July 2024
© 2024. Indographics. This is an open access article published by Thieme under the terms of the Creative Commons Attribution-NonDerivative-NonCommercial License, permitting copying and reproduction so long as the original work is given appropriate credit. Contents may not be used for commercial purposes, or adapted, remixed, transformed or built upon. (https://creativecommons.org/licenses/by-nc-nd/4.0/)
Thieme Medical and Scientific Publishers Pvt. Ltd.
A-12, 2nd Floor, Sector 2, Noida-201301 UP, India
-
References
- 1 World Health Organization. Global Tuberculosis report 2023. Accessed February 11, 2024 at: https://iris.who.int/bitstream/handle/10665/373828/9789240083851-eng.pdf?sequence=1
- 2 Sharma R, Madhusudhan KS, Ahuja V. Intestinal tuberculosis versus Crohn's disease: clinical and radiological recommendations. Indian J Radiol Imaging 2016; 26 (02) 161-172
- 3 Mandavdhare HS, Singh H, Sharma V. Recent advances in the diagnosis and management of abdominal tuberculosis. EMJ Gastroenterol 2017; 6 (01) 52-60
- 4 Pratap Mouli V, Munot K, Ananthakrishnan A. et al. Endoscopic and clinical responses to anti-tubercular therapy can differentiate intestinal tuberculosis from Crohn's disease. Aliment Pharmacol Ther 2017; 45 (01) 27-36
- 5 Gupta A, Pratap Mouli V, Mohta S. et al. Antitubercular therapy given to differentiate Crohn's disease from intestinal tuberculosis predisposes to stricture formation. J Crohn's Colitis 2020; 14 (11) 1611-1618
- 6 Leder RA, Low VH. Tuberculosis of the abdomen. Radiol Clin North Am 1995; 33 (04) 691-705
- 7 De Backer AI, Mortelé KJ, Deeren D, Vanschoubroeck IJ, De Keulenaer BL. Abdominal tuberculous lymphadenopathy: MRI features. Eur Radiol 2005; 15 (10) 2104-2109
- 8 Vanhoenacker FM, De Backer AI, Op de BB. et al. Imaging of gastrointestinal and abdominal tuberculosis. Eur Radiol 2004; 14 (Suppl. 03) E103-E115
- 9 Ladumor H, Al-Mohannadi S, Ameerudeen FS, Ladumor S, Fadl S. TB or not TB: a comprehensive review of imaging manifestations of abdominal tuberculosis and its mimics. Clin Imaging 2021; 76: 130-143
- 10 Joshi AR, Basantani AS, Patel TC. Role of CT and MRI in abdominal tuberculosis. Curr Radiol Rep 2014; 2: 66
- 11 Akhan O, Pringot J. Imaging of abdominal tuberculosis. Eur Radiol 2002; 12 (02) 312-323
- 12 Suarez T, Garcia V, Estrada T, Acosta F. Imaging in abdominal tuberculosis. Rev Colomb Radiol. 2010; 21 (04) 1-11
- 13 Suri S, Gupta S, Suri R. Computed tomography in abdominal tuberculosis. Br J Radiol 1999; 72 (853) 92-98
- 14 Na-ChiangMai W, Pojchamarnwiputh S, Lertprasertsuke N, Chitapanarux T. CT findings of tuberculous peritonitis. Singapore Med J 2008; 49 (06) 488-491
- 15 Ha HK, Jung JI, Lee MS. et al. CT differentiation of tuberculous peritonitis and peritoneal carcinomatosis. AJR Am J Roentgenol 1996; 167 (03) 743-748
- 16 Pang Y, Li Y, Xu D, Sun X, Hou D. Differentiating peritoneal tuberculosis and peritoneal carcinomatosis based on a machine learning model with CT: a multicentre study. Abdom Radiol (NY) 2023; 48 (04) 1545-1553
- 17 Singhal M, Krishna S, Lal A. et al. Encapsulating peritoneal sclerosis: the abdominal cocoon. Radiographics 2019; 39 (01) 62-77
- 18 Balthazar EJ, Gordon R, Hulnick D. Ileocecal tuberculosis: CT and radiologic evaluation. AJR Am J Roentgenol 1990; 154 (03) 499-503
- 19 Sharma MP, Ahuja V. Abdominal (gastrointestinal tract) tuberculosis in adult. In: Schaaf HS, Zumla AI, Grange JM. eds. Tuberculosis: A Comprehensive Clinical Reference. Edinburgh: Saunders/Elsevier; 2009: 424-431
- 20 Gupta P, Kumar S, Sharma V. et al. Common and uncommon imaging features of abdominal tuberculosis. J Med Imaging Radiat Oncol 2019; 63 (03) 329-339
- 21 Yang G, Zhang W, Yu T. et al. The features of intestinal tuberculosis by contrast-enhanced ultrasound. Jpn J Radiol 2015; 33 (09) 577-584
- 22 Kalra N, Agrawal P, Mittal V. et al. Spectrum of imaging findings on MDCT enterography in patients with small bowel tuberculosis. Clin Radiol 2014; 69 (03) 315-322
- 23 Bhatt S, Roy S, Bhardwaj N. et al. Kaleidoscopic view of bowel tuberculosis on multi- detector computed tomography (CT) enterography - a novel technique unfolding an archaic disease. Pol J Radiol 2017; 82: 783-791
- 24 Krishna S, Kalra N, Singh P. et al. Small-bowel tuberculosis: a comparative study of MR enterography and small-bowel follow-through. AJR Am J Roentgenol 2016; 207 (03) 571-577
- 25 Sharma SK, Mohan A. Extrapulmonary tuberculosis. Indian J Med Res 2004; 120 (04) 316-353
- 26 Kedia S, Sharma R, Vuyyuru SK. et al. Addition of computed tomography chest increases the diagnosis rate in patients with suspected intestinal tuberculosis. Intest Res 2022; 20 (02) 184-191
- 27 Choudhury A, Dhillon J, Sekar A, Gupta P, Singh H, Sharma V. Differentiating gastrointestinal tuberculosis and Crohn's disease- a comprehensive review. BMC Gastroenterol 2023; 23 (01) 246
- 28 Kedia S, Madhusudhan KS, Sharma R. et al. Combination of increased visceral fat and long segment involvement: development and validation of an updated imaging marker for differentiating Crohn's disease from intestinal tuberculosis. J Gastroenterol Hepatol 2018; 33 (06) 1234-1241
- 29 Khan MS, Maan MHA, Sohail AH, Memon WA. Primary esophageal tuberculosis mimicking esophageal carcinoma on computed tomography: a case report. World J Gastrointest Surg 2019; 11 (09) 373-380
- 30 Lee KH, Kim HJ, Kim KH, Kim HG. Esophageal tuberculosis manifesting as submucosal abscess. AJR Am J Roentgenol 2003; 180 (05) 1482-1483
- 31 Nagi B, Lal A, Kochhar R. et al. Imaging of esophageal tuberculosis: a review of 23 cases. Acta Radiol 2003; 44 (03) 329-333
- 32 Debi U, Ravisankar V, Prasad KK, Sinha SK, Sharma AK. Abdominal tuberculosis of the gastrointestinal tract: revisited. World J Gastroenterol 2014; 20 (40) 14831-14840
- 33 Padma V, Anand NN, Rajendran SM, Gurukal S. Primary tuberculosis of stomach. J Indian Med Assoc 2012; 110 (03) 187-188
- 34 Pereira JM, Madureira AJ, Vieira A, Ramos I. Abdominal tuberculosis: imaging features. Eur J Radiol 2005; 55 (02) 173-180
- 35 Bhatti A, Hussain M, Kumar D, Samo KA. Duodenal tuberculosis. J Coll Physicians Surg Pak 2012; 22 (02) 111-112
- 36 Dahiya D, Garg M, Kaman L, Rana S, Rao C, Behera A. Duodenal tuberculosis–a rare case report and review of literature. Pol Przegl Chir 2013; 85 (08) 464-466
- 37 Nagi B, Lal A, Gupta P, Kochhar R, Sinha SK. Radiological findings in duodenal tuberculosis: a 15-year experience. Abdom Imaging 2015; 40 (05) 1104-1109
- 38 Chavhan GE, Ramakantan R. Duodenal tuberculosis: radiological features on barium studies and their clinical correlation in 28 cases. J Postgrad Med 2003; 49 (03) 214-217
- 39 Nagi B, Kochhar R, Bhasin DK, Singh K. Colorectal tuberculosis. Eur Radiol 2003; 13 (08) 1907-1912
- 40 Mukewar S, Mukewar S, Ravi R, Prasad A. S Dua K, Colon tuberculosis: endoscopic features and prospective endoscopic follow-up after anti-tuberculosis treatment. Clin Transl Gastroenterol 2012; 3 (10) e24
- 41 Verma K, Pai VD, Patil PS, Bal M, Saklani AP. Isolated colorectal tuberculosis masquerading as malignancy: a case series. Trop Gastroenterol 2016; 37 (03) 227-230
- 42 Azadi A, Jafarpour Fard P, Sagharjoghi Farahani M, Khodadadi B, Almasian M. Anal tuberculosis: a non-healing anal lesion. IDCases 2018; 12: 25-28
- 43 Pandit K, Khanal S, Bhatta S, Trotter AB. Anorectal tuberculosis as a chronic rectal mass mimicking rectal prolapse in a child-a case report. Ann Med Surg (Lond) 2018; 36: 264-266
- 44 Choi YS, Kim DS, Lee JB. et al. Clinical features of tuberculous versus Crohn's anal fistulas, in Korea. J Crohn's Colitis 2015; 9 (12) 1132-1137
- 45 Makanjuola D, al Orainy I, al Rashid R, Murshid K. Radiological evaluation of complications of intestinal tuberculosis. Eur J Radiol 1998; 26 (03) 261-268
- 46 Coccolini F, Ansaloni L, Catena F, Lazzareschi D, Puviani L, Pinna AD. Tubercular bowel perforation: what to do?. Ulus Travma Acil Cerrahi Derg 2011; 17 (01) 66-74
- 47 Gayathre SP, Kudiyarasu, Kannan R, Shajini N. A rare complication of the great mimicker: free tubercular ileal perforation. Int Surg J 2021; 8 (04) 1366-1369
- 48 Dong P, Chen JJ, Wang XZ, Wang YQ. Intraperitoneal tuberculous abscess: computed tomography features. World J Radiol 2015; 7 (09) 286-293
- 49 Vetri R, Kannichamy V, Jacob VA, Sainath S. Abdominal tuberculosis presenting as an umbilical sinus: a case report. Cureus 2022; 14 (11) e31184
- 50 Singh H, Mandavdhare H, Sharma V. All that fistulises is not Crohn's disease: multiple entero-enteric fistulae in intestinal tuberculosis. Pol Przegl Chir 2019; 91 (01) 35-37
- 51 Wu P, Zeng J, Yang L. Case report: vesicorectal fistula caused by intestinal tuberculosis complicated with systemic lupus erythematosus. Infect Drug Resist 2022; 15: 6237-6243
- 52 Bavunoglu I, Ayan F, Karabicak I. et al. Selective jejunal artery pseudoaneurysm embolization in a patient with massive gastrointestinal bleeding due to intestinal tuberculosis. J Emerg Med 2006; 31 (04) 391-394
- 53 Karaosmanoglu AD, Onur MR, Sahani DV, Tabari A, Karcaaltincaba M. Hepatobiliary tuberculosis: imaging findings. AJR Am J Roentgenol 2016; 207 (04) 694-704
- 54 Venkatesh SK, Tan LK, Siew EP, Putti TC. Macronodular hepatic tuberculosis associated with portal vein thrombosis and portal hypertension. Australas Radiol 2005; 49 (04) 322-324
- 55 Yu RS, Zhang SZ, Wu JJ, Li RF. Imaging diagnosis of 12 patients with hepatic tuberculosis. World J Gastroenterol 2004; 10 (11) 1639-1642
- 56 Jain N, Rissam HK, Puri SK, Chauhan U. The “frosted liver” appearance in hepatic tuberculosis: a rare presentation. BJR Case Rep 2016; 2 (04) 20150367
- 57 Israrahmed A, Agarwal S, Singh S, Lal H. 'Frosted liver' appearance in serohepatic variant of hepatic tuberculosis. BMJ Case Rep 2021; 14 (03) e241643
- 58 Ray S, Das K, Mridha AR. Pancreatic and peripancreatic nodal tuberculosis in immunocompetent patients: report of three cases. JOP 2012; 13 (06) 667-670
- 59 Dou Y, Liang Z. Pancreatic tuberculosis: a computed tomography imaging review of thirteen cases. Radiol Infect Dis 2019; 6: 31-37
- 60 De Backer AI, Mortelé KJ, Bomans P, De Keulenaer BL, Vanschoubroeck IJ, Kockx MM. Tuberculosis of the pancreas: MRI features. AJR Am J Roentgenol 2005; 184 (01) 50-54
- 61 Gupta A, Gupta A, Anjum R, Agrawal S, Mallik D. A comprehensive review on primary gallbladder tuberculosis. Pol Przegl Chir 2018; 90 (02) 10-12
- 62 Xu XF, Yu RS, Qiu LL, Shen J, Dong F, Chen Y. Gallbladder tuberculosis: CT findings with histopathologic correlation. Korean J Radiol 2011; 12 (02) 196-202
- 63 Runner GJ, Corwin MT, Siewert B, Eisenberg RL. Gallbladder wall thickening. AJR Am J Roentgenol 2014; 202 (01) W1-W12
- 64 Kritika SR, Tiwari T, Goyal S. CT evaluation of different forms of abdominal tuberculosis: a series of multiple cases. Japanese J Gastroenterol Res. 2022; 2 (09) 1090
- 65 Naeem M, Zulfiqar M, Siddiqui MA. et al. Imaging manifestations of genitourinary tuberculosis. Radiographics 2021; 41 (04) 1123-1143
- 66 Guo YK, Yang ZG, Li Y. et al. Addison's disease due to adrenal tuberculosis: contrast-enhanced CT features and clinical duration correlation. Eur J Radiol 2007; 62 (01) 126-131
- 67 Zhang XC, Yang ZG, Li Y. et al. Addison's disease due to adrenal tuberculosis: MRI features. Abdom Imaging 2008; 33 (06) 689-694
- 68 Gupta S, Ansari MAM, Gupta AK, Chaudhary P, Bansal LK. Current approach for diagnosis and treatment of adrenal tuberculosis-our experience and review of literature. Surg J (NY) 2022; 8 (01) e92-e97
- 69 Kedia S, Das P, Madhusudhan KS. et al. Differentiating Crohn's disease from intestinal tuberculosis. World J Gastroenterol 2019; 25 (04) 418-432
- 70 Ma L, Zhu Q, Li Y. et al. The potential role of CT enterography and gastrointestinal ultrasound in the evaluation of anti-tubercular therapy response of intestinal tuberculosis: a retrospective study. BMC Gastroenterol 2019; 19 (01) 106
- 71 Rathi V, Yadav V, Deep BS, Bhatt S, Giri S. CT appearances in treated abdominal tuberculosis: a radiologist's dilemma. J Gastrointestinal Abdominal Radiol ISGAR 2022; 5: 30-36
- 72 Aggarwal P, Kedia S, Sharma R. et al. Tubercular intestinal strictures show a poor response to anti-tuberculous therapy. Dig Dis Sci 2017; 62 (10) 2847-2856
- 73 Jena A, Mohindra R, Rana K. et al. Frequency, outcomes, and need for intervention in stricturing gastrointestinal tuberculosis: a systematic review and meta-analysis. BMC Gastroenterol 2023; 23 (01) 46
- 74 Sasi A, Ahuja V, Das CJ. et al. Assessment of CT perfusion indices of the clinicoradiological response to anti-tubercular therapy in patients with intestinal tuberculosis. Clin Radiol 2023; 78 (12) e1081-e1086
- 75 Mathur P, Sharma R, Kandasamy D, Kedia S, Gamanagatti S, Ahuja V. Can ADC be used as a surrogate marker of response to therapy in intestinal tuberculosis?. Abdom Radiol (NY) 2019; 44 (09) 3006-3018
- 76 Tian G, Xiao Y, Chen B, Xia J, Guan H, Deng Q. FDG PET/CT for therapeutic response monitoring in multi-site non-respiratory tuberculosis. Acta Radiol 2010; 51 (09) 1002-1006
- 77 Jha DK, Pathiyil MM, Sharma V. Evidence-based approach to diagnosis and management of abdominal tuberculosis. Indian J Gastroenterol 2023; 42 (01) 17-31
- 78 Suri R, Gupta S, Gupta SK, Singh K, Suri S. Ultrasound guided fine needle aspiration cytology in abdominal tuberculosis. Br J Radiol 1998; 71 (847) 723-727