

Subscribe to RSS
DOI: 10.1055/s-0044-1796643
CECT and CT Perfusion Correlation with Pathological Differentiation of Pharyngeal and Laryngeal Cancers: Study from a Tertiary Care Center in Northeast India
Authors
Funding None.


Abstract
Introduction Pharyngeal and laryngeal carcinomas, included under head and neck cancers, pose a significant challenge in India, accounting for around one-third of all cancer cases. Noninvasive techniques like contrast-enhanced computed tomography (CECT) and CT perfusion (CTp) can help explore the correlation between tumor differentiations, which can greatly benefit in the diagnosis, understanding of recurrence postintervention, and monitoring of the progress of the disease.
Materials and Methods A hospital-based cross-sectional study was conducted for a duration of 18 months in a tertiary care center of northeast India with a sample of 40 patients. CECT and CTp were done and the variables were correlated with pathological differentiation of tumors.
Results The mean age of the study population was 54 years. No statistically significant associations were noted between the age, size, margins, location, and T-staging of tumors with the pathological differentiation of tumors. However, significant association was found between the CTp parameters, namely blood flow (BF), blood volume, mean transit time, time to drain, and time to peak with respect to the pathological differentiation of tumors (p < 0.05).
Conclusion The addition of CTp to conventional CT sequences in the evaluation of pharyngeal and laryngeal cancers offers significant benefits in understanding the tumor physiology and behavior.
Keywords
blood flow - blood volume - computed tomography perfusion - contrast-enhanced computed tomography - mean transit time - pharyngeal and laryngeal cancers - time to drain - time to peakIntroduction
Pharyngeal and laryngeal carcinomas, considered under a wider ambit of head and neck cancers (HNCs) are one of the most common malignant tumors. While these tumors are diverse, over 90% are squamous cell carcinomas (SCCs).[1] HNCs pose a significant challenge in a developing country like India, accounting for around one-third of all cancer cases, whereas in developed nations, they typically represent only 4 to 5% of cases.[2] Since the inception of cancer registries in the northeastern states of India in 2003, the incidence rates of cancer across all sites have consistently been the highest in this region.[3] Historically, head and neck squamous cell carcinomas (HNSCCs) were considered a relatively homogeneous group differentiated mainly by their anatomical locations.
Multidetector computed tomography (MDCT) enables the assessment of functional parameters in oncology patients, including tissue perfusion, by effectively combining morphological information obtained from conventional CT techniques. CT perfusion (CTp) imaging is a dynamic contrast-enhanced method specifically designed to quantitatively evaluate tissue microcirculation.[4] Developed nearly three decades ago, this technique was originally created to quantify cerebral blood perfusion in patients experiencing acute stroke[5]; however, it has recently emerged as a significant noninvasive tool for assessing microcirculatory changes seen with various types of tumors like hepatocellular carcinoma,[6] pancreatic cancers,[7] and HNCs.[8]
Rationale: With the help of some noninvasive techniques like contrast-enhanced computed tomography (CECT) and CTp, the correlation of the differentiation of the tumors can be explored, which can greatly benefit in the diagnosis, understanding of recurrence postinterventions, and monitoring of the progress of the disease.[9]
Novelty: CTp can aid in diagnosis, staging, risk assessment, and monitoring therapy for patients with cancer.[10] Metabolic imaging techniques such as single photon emission computed tomography (SPECT) and positron emission tomography (PET) can aid in this direction. However, they are costly, not easily available, and notably have a lower specificity.[11]
Aims and Objectives
The objective of the study was to understand the correlation of CECT findings and CTp parameters with histopathological differentiation of pharyngeal and laryngeal cancers.
Materials and Methods
Study Design: A hospital-based cross-sectional study (diagnostic utility) was conducted for a duration of 18 months from October 2022 to April 2024 at a tertiary care center in Northeast India. Approval from Institutional Ethics Committee (IEC) was obtained before the study was conducted (IEC no.: NEIGR/IEC/M7/T22/2022). Forty cases were included in the study.
Study Participants
-
Study population: individuals with suspected clinical/radiological/pathological cases of pharyngeal and laryngeal cancer.
-
Inclusion criteria: individuals whose biopsy reports came out to be positive for pharyngeal or laryngeal cancer.
-
Exclusion criteria: individuals who were unable to undergo CECT scan due to contraindications were excluded from the study.
Statistical tests used for data analysis: data were analyzed using SPSS V21 software. Categorical variables were presented as frequency and percentages. Continuous varieties were presented as mean (standard deviation [SD]) or median (interquartile range [IQR]), depending on the type of distribution. Analysis of variance (ANOVA) was used to determine the association between CECT findings and CTp parameters with the differentiation of carcinoma according to biopsy report. The receiver operating characteristic (ROC) curve was used to determine the validity of CTp and CECT in predicting the differentiation of carcinoma by biopsy. A p-value less than 0.05 was considered statically significant.
Study procedure: patients with suspected pharyngeal and laryngeal tumors were routinely subjected to CECT as a part of the diagnostic and staging workup. In addition to the routine CECT, without the need for additional contrast, CTp images were acquired. Consent was taken after proper explanation regarding the procedure and the risks associated with it. The patients were informed about the increased exposure to radiation compared with a conventional CECT scan due to the increased duration of the scan. Relevant statistical tests were applied to the data obtained. The results were correlated and compared with the histopathological grading of the tumor.
Materials Used
-
Image acquisition: all CT scans were performed with a 128-slice, Siemens DEFINITION As + EXCEL CT scanner (Siemens AG, Germany) with the facility of real-time CT fluoroscopy. A high-pressure syringe (CT dual head pressure injector model: Salient Dual Syringe from IMAXEON, MEDRAD) was used. All image data were transmitted directly to workstation syngo.via.
-
Image analysis: the imaging characteristics were described and enumerated according to the list of parameters under consideration. The histological diagnosis and the types were obtained from the department of pathology.
List of Variables and Their Measurement Methods with Standardization Techniques
Outcome Variables
The CECT variables included the following:
-
Lesion size: the maximum dimensions of the lesion were measured to the nearest millimeter using a caliper tool in axial, coronal, and sagittal planes using multiplanar reformatted images. All measurements were made in the soft tissue window in the arterial phase.
-
Location: the lesion was characterized to be located at the region of the pharynx and larynx based on the center of the lesion.
-
Margins: the margins of the lesion were categorized as ill or well defined.
The CTp variables included blood volume (BV), blood flow (BF), mean transit time (MTT), time to drain (TTD), and time to peak (TTP).
The histopathological variables included well-differentiated, moderately differentiated, and undifferentiated tumors.
The method involved the following steps:
-
CTp was conducted using a 128-slice CT scanner for all the patients.
-
The patients' serum urea and creatinine levels were ensured to be with considerable levels with estimated glomerular filtration rate (eGFR) > 60 mL/min/1.73 m2.
-
An intravenous cannula size of 18 or 20 gauge was used, targeting the major vessels.
-
The patients were instructed to maintain quiet breathing and avoid swallowing during the procedure.
The Operating Protocol
Noncontrast CT (NCCT) was performed initially to determine the location of the lesion.
CTp was then conducted using a 128-slice CT scanner with Z-axis coverage of 3 to 4 cm. The contrast injection protocol was as follows:
-
Iodinated nonionic contrast of 40 to 50 mL with an iodine concentration of 350 mg/mL.
-
Injection rate of 5 mL/s, through an intravenous wide bore cannula.
-
A saline flush of 30 mL using an automatic pressure injector.
Perfusion scanning commenced 5 seconds after the start of contrast injection and continued for 40 seconds. The imaging parameters for perfusion were the following:
-
Voltage: 80 kV.
-
Tube current: 50 to 200 mA with automated tube modulation.
-
Rotation time: 0.1 seconds.
-
Slice thickness: 5 mm.
-
Noise index: 15.
CECT was performed from the skull base to the thoracic outlet. The contrast medium was injected at a rate of 1.25 mL/kg, and scanning started 40 seconds after injection.
CT Image and Perfusion Analysis
The CTp data analysis was conducted using the Syngo multimodality workplace (Siemens, Erlangen, Germany). The attenuation thresholds were adjusted to omit bone structures. The analysis employed Patlak's two-compartment model deconvolution technique. Regions of interest (ROIs) outlining the enhancing tumor margin were manually placed on the perfusion maps, using corresponding CECT images as a reference. The arterial input function was determined by placing a circular ROI in the internal carotid artery at the tumor level. Subsequently, a time–density curve was generated with the creation of perfusion maps.
These parameters were defined as follows:
-
○ BF (mL/100 g/min) represents the volume of blood flowing through a specific tissue per unit of time.
-
○ BV (mL/100 g) indicates the total volume of blood within a given tissue region.
-
○ MTT (seconds) represents the average time required for the iodinated contrast medium to move from the input artery through the tissue's microcirculation. It can be determined by dividing the BV by the BF, as described by the central volume theorem.
-
○ TTD (seconds) refers to the time required for contrast material to clear from the blood vessels in a certain region of tissue, reflecting how efficiently blood is moving through that area.
-
○ TTP (seconds) refers to the duration between the arrival of contrast in the primary arterial vessels and the peak enhancement, indicating the perfusion pressure.
Images of representative cases are described in [Figs. 1] [2] [3] [4].


Results and Observations
The total number of patients who were a part of this study was 40, with 20 cases of moderately differentiated carcinoma, 10 cases of well-differentiated carcinoma, and 10 cases of poorly differentiated carcinoma. Twenty-eight (70%) of our patients were males and 12 (30%) were females. Most of the carcinomas (16, 40%) were in the hypopharynx, followed by 12 (30%) in the oropharynx, 8 (20%) in the nasopharynx, and 4 (10%) in the larynx. Twenty-eight (70%) were ill marginated and 12 (30%) were well marginated. The majority of the carcinomas were moderately differentiated (20, 50%), while 10 (25%) were well differentiated and 10 (25%) were poorly differentiated. The commonest tumor staging was T4 at 15 (37.5%), followed by T3 at 14 (35%), T2 at 10 (25%), and T1 at 1 (2.5%; [Table 1]).
Abbreviations: AP, anteroposterior; BF, blood flow; BV, blood volume; CC, craniocaudal; MTT, mean transit time; TR, transverse; TTD, time to drain; TTP, time to peak.
Chi-squared tests were used to analyze the categorical data and assess the association between variables ([Table 2] [3] [4]).
Note: No statistically significant association noted between the location and pathological differentiation of tumors (considering p ≤ 0.05).
Note: No statistically significant association noted between the margin and pathological differentiation of tumors (considering p ≤ 0.05).
Note: No statistically significant association noted between the T-staging and pathological differentiation of tumors (considering p ≤ 0.05).
ANOVA with multiple comparison groups to compare variances across the means (or average) of different groups was performed ([Table 5]).
-
A significant difference was noted in the mean BF score among the pathological differentiation groups. It was observed that the lowest mean score was associated with poorly differentiated tumors (173.28 ± 121.22), followed by moderate differentiated tumors (331.3 ± 287.09) and well-differentiated tumors (1,677.04 ± 797.62; p < 0.001).
-
A significant difference was noted in the mean BV score among the pathological differentiation groups. It was observed that the lowest mean score was associated with poorly differentiated tumors (25.59 ± 12.53), followed by moderate differentiated tumors (62.56 ± 49.58) and well-differentiated tumors (144.41 ± 101.93; p < 0.001).
-
A significant difference was noted in the mean MTT score among the pathological differentiation groups. It was observed that the lowest mean score was associated with well-differentiated tumors (5.43 ± 1.28), followed by moderate differentiated tumors (7.12 ± 1.32) and poorly differentiated tumors (10.16 ± 2.4; p < 0.001).
-
A significant difference was noted in the mean TTD score among the pathological differentiation groups. It was observed that the lowest mean score was associated with well-differentiated tumors (5.03 ± 2.07), followed by moderate differentiated tumors (7.46 ± 1.56) and poorly differentiated tumors (9.73 ± 2.52; p < 0.001).
-
A significant difference was noted in the mean TTP score among the pathological differentiation groups. It was observed that the lowest mean score was associated with well-differentiated tumors (17.08 ± 6.41), followed by moderate differentiated tumors (22.93 ± 5.52) and poorly differentiated tumors (27.4 ± 5.5; p < 0.001).
Abbreviations: AP, anteroposterior; BF, blood flow; BV, blood volume; CC, craniocaudal; MTT, mean transit time; TR, transverse; TTD, time to drain; TTP, time to peak.
Note: No statistically significant correlation was noted between the age, size, margins, location, and T-staging of tumors with the pathological differentiation of tumors (considering p ≤ 0.05).
A statistically significant correlation was noted between the CTp parameters with the pathological differentiation of tumors (considering p ≤ 0.05). Well-differentiated tumors show higher blood flow and blood volume, whereas poorly differentiated tumors have increased mean transit time, time to peak, and time to drain.
ROC curves were used to determine an optimal cutoff as described in [Fig. 5]. Based on the ROC curve and Youden's J index, the optimal cutoff point to differentiate well and other histological grades were observed as the following:
-
733.5 with 93.3% sensitivity and 100.0% specificity for the test result variable BF.
-
60.85 with 73.3% sensitivity and 80.0% specificity for the test result variable BV.
-
6.750 with 80% sensitivity and 100% specificity for the test result variable MTT.
-
6.8 with 76.7% sensitivity and 100% specificity for the test result variable TTD.
-
16.5 with 93.6% sensitivity and 60.0% specificity for the test result variable TTP.
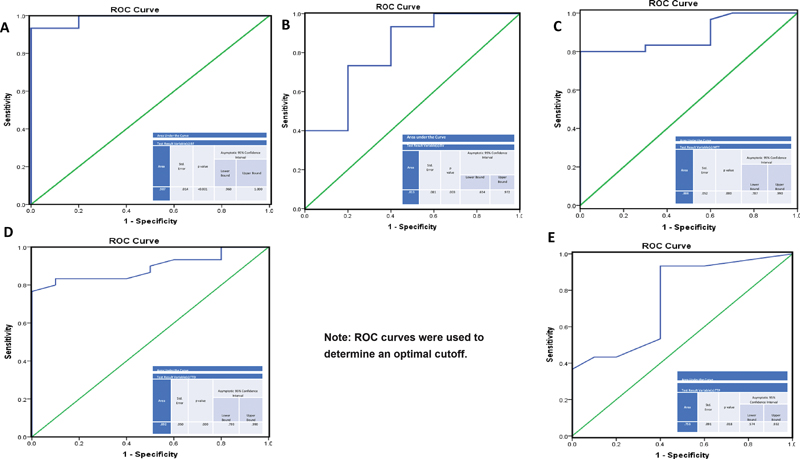
Considering the area under the curve and the sensitivity and specificity values, BF was the most accurate parameter, with TTP showing the least specificity.
Discussion
Disease burden: pharyngeal and laryngeal cancers rank among the top 10 leading causes of cancer among Indian men. Cancer incidence in India is increasing. Global cancer observatory (GLOBOCAN) 2020 projects that by 2040, there will be 2.1 million new cancer cases in the country, marking a 57.5% increase from 2020.[12] Additionally, one in every nine Indians faces a lifetime risk of developing a carcinoma. HNC specifically accounts for almost 30% of all cancer cases.[12] The northeastern registries have recorded the highest incidence of HNC in males, with a rate of 31.7 (95% confidence interval [CI]: 31.1–32.3) per 100,000 population. The registries from northern and central India have reported rates of 28.5 (95% CI: 27.9–29.1) and 28.3 (95% CI: 27.4–29.2) per 100,000 population, respectively.
Etiology: HNCs arise from a combination of predispositions linked to specific genetic characteristics and exposure to carcinogens resulting from lifestyle behaviors. Furthermore, simultaneous exposure to multiple risk factors has a synergistic effect, significantly increasing the risk of cancers.[13] Roughly 57% of men and 11% of women in India between the ages of 15 and 49 years use some form of tobacco. Cigarette smoking accounts for approximately one-fourth of oral and oropharyngeal cancer cases.[14] Regular alcohol consumption is linked to a higher risk of oral cancer, and this risk is dependent on the amount consumed. In total, heavy alcohol consumption contributes to 7 to 19% of oral cavity cancer cases.[15] Combining alcohol consumption with tobacco use in any form further elevates the risk of oral cancer by 11-fold.[15] Human papillomavirus (HPV) 16 is becoming increasingly recognized as a causative agent in oropharyngeal and oral SCC.[16] Erosive oral cavity lichen planus may be linked to an increased risk of cancer. Iron deficiency anemia, combined with symptoms such as dysphagia and postcricoid webs (Plummer–Vinson syndrome), is linked to an increased risk of developing carcinoma in the oral cavity, oropharynx, and esophagus.[17] Most precancerous lesions preceding oral cavity cancers share similar causes with oral cavity cancers and are predominantly observed in tobacco users. There are three primary types of these lesions, namely, erythroplakia, leukoplakia, and submucosal fibrosis.[18] Proper diet and immunity are considered protective for HNC.[14] Inherited conditions linked to an increased risk of HNSCC include Fanconi anemia (FA), ataxia telangiectasia, Li–Fraumeni syndrome, and Bloom's syndrome.[19]
CTp: dynamic contrast-enhanced (DCE) computed tomography (CT) has evolved significantly since it was first proposed by Axel in the late 1970s. Initially developed almost 50 years ago for assessing cerebral blood perfusion in acute stroke patients, this method measures temporal changes in tissue density within a fixed target lesion, providing insights into tissue perfusion. Additionally, DCE-CT has gained renewed attention due to advances in anti-angiogenesis therapies for tumors.[20]
CTp provides a noninvasive means of measuring intratumoral microvessel density (MVD) and tumor oxygenation status. This technique has demonstrated a prognostic value, especially in the evaluation of head and neck tumors after radiotherapy/chemotherapy. CTp is fast and widely available, making it a convenient imaging modality. Therefore, CTp can serve as a surrogate marker for intratumoral MVD and oxygenation, providing valuable information for assessing tumor physiology and treatment response.[21] Multiple studies have confirmed the effectiveness of CTp as a biomarker for assessing angiogenesis and monitoring treatment response in cancer patients.[21] CTp offers important insights into the functional behavior and vascular physiology of tumors. It has proven to be a practical and useful technique both for monitoring treatments and for forecasting local outcomes in patients undergoing chemotherapy and radiation therapy.[22] CTp may facilitate better differentiation between local tumor recurrence and nonspecific posttherapy changes like fibrosis, edema, soft tissue thickening, and sometimes necrosis.[23]
Extra radiation incurred by patients in CTp: the overall effective dose per procedure for a contrast procedure of the neck ranges from 1.3 to 11.7 mSv.[24] There will be a minimal increase in exposure to radiation compared with a conventional CECT scan due to the increased duration of the scan. CTp is indeed a dose-intensive imaging method, which poses concerns regarding radiation exposure. For instance, during a perfusion procedure of the brain, the radiation dose can range from approximately 100 to 190 mGy.[25] Reducing radiation dose in CTp is essential to minimize the risk of radiation-induced harm while maintaining image quality for accurate diagnosis by implementing various methods such as lowering tube voltage (kVp), reducing tube current (mA), and limiting the scan to the area of interest. The use of emerging techniques using artificial intelligence and deep learning can further enhance image quality at reduced radiation doses along with the use of iterative reconstruction algorithms instead of traditional filtered back projection.
Age distribution: the mean age of our study population was 54 years. The median age of the patients was 55 years. The mean age of the patients with poorly differentiated tumors (55 years) was higher than the mean ages of the patients with moderately differentiated tumors (54 years) and poorly differentiated tumors (53 years). Sharma et al[26] found a bimodal age distribution with peaks in age groups of 15 to 24 and 65 to 74 years. However, no bimodal age distribution was noted in our study.
Sex distribution: a male preponderance has been reported in most cancer studies across the world.[26] Our study showed a male-to-female ratio of 2.3:1, which is in line with the National Cancer Registry Program, 2023.
Pathological distribution: the majority of the male patients in our study had moderately differentiated carcinomas (50%), followed by equal incidence of well and poorly differentiated carcinomas. However, female patients had equal incidence of moderately and poorly differentiated carcinomas. Our findings are in line with a study done by Ding et al.[27]
Location of tumors: most of the carcinomas were in the hypopharynx (40%), followed by the oropharynx (30%), nasopharynx (20%), and larynx (10%). Most of the lesions were centered in the pyriform fossa, followed by the base of the tongue. This finding is different from other studies where cancers of the oropharynx predominate the pharyngeal and laryngeal cancers as indicated in a study by Argiris et al.[28]
Margins of tumors: most of the carcinomas were well marginated (70%), with 30% of the tumors showing ill-defined margins. According to a study by Oren et al,[29] HPV-positive SCCs typically show clear margins and may exhibit cystic nodal metastases, whereas HPV-negative tumors often present with indistinct borders.
Tumor staging: the commonest tumor staging was T4 (37.5%), followed by T3 (35%), T2 (25%), and T1 (2.5%). This distribution indicates that patients present very late to hospitals, only when there is severe disruption of daily functions or when overt clinical symptoms have set in. Our findings are similar to those of a study conducted by Gormley et al[30] where a meta-analysis was done on multiple databases and it was found that stage IV is the most common diagnosed stage for oropharyngeal cancer, whereas stage I is most common stage at diagnosis for laryngeal cancer.
No statistically significant association was noted between age, size, margins, location, and T-staging of tumors with the pathological differentiation of tumors. However, significant association was found between the CTp parameters, namely, BF, BV, MTT, TTD, and TTP, with the pathological differentiation of tumors. There was increased BF and BV in well-differentiated tumors. This is also correlated by the fact that well-differentiated tumors show better response to chemoradiotherapy owing to this increased angiogenesis and BF.[31] There was increased MTT, TTD, and TTP in poorly differentiated tumors with a statistically significant association as demonstrated. Our study agrees with other studies done in similar lines ([Table 6]).
|
Hayano et al[32] |
Well-differentiated tumors show higher blood flow (BF) and blood volume (BV) |
|
d'Assignies et al[33] |
The mean transit time was longer in poorly differentiated tumors and in tumors with lymph node metastasis |
|
Ash et al[34] |
Positive correlation between BF and BV parameters from computed tomography (CT) perfusion of the neck and microvascular density in head and neck squamous cell carcinomas (HNSCC) |
|
Trojanowska[23] |
Perfusion CT, apart from helping in the delineation of tumor, may have a very powerful role in predicting outcome in head and neck cancer after radiotherapy |
|
This study |
Well-differentiated tumors show higher blood flow and blood volume, whereas poorly differentiated tumors have increased mean transit time, time to peak, and time to drain |
Conclusion
Pharyngeal and laryngeal cancers are very common in the northeastern region of India. Early clinical suspicion and confirmation with radiological imaging and biopsy are imperative in treating the patient. CTp can tell us about the functional analysis of tumors and allow us for aggressive and early initiation of treatment in suspected cases of poorly differentiated tumors. Carrying out a biopsy is difficult in some discreet cases of HNC, and it is also contraindicated in some cases of bleeding diathesis as well as infection at the site of the lesion. Perfusion imaging can help in the precise delineation of tumor margins, which is critical for surgical and radiotherapy planning. In oncologic emergencies, CTp can play a vital role and act as the game changer in categorizing tumors and accordingly planning the intervention while the biopsy report is awaited, which usually takes some time. Given the significant advantages in functional analysis, early detection, and treatment planning, adding CTp to the routine imaging protocol for pharyngeal and laryngeal cancers is highly recommended.
Limitations and Future Directions
Further studies can be conducted with a bigger cohort and in multicentric settings to confirm our observations. Studies can also be done to understand the effect of radiation and postradiational assessment of the tumor as well to differentiate between benign and malignant lymph nodes. Dedicated CTp studies can be conducted focused on only one anatomical subset of HNC. An optimal CTp protocol can be devised in cases of HNC and incorporated into routine contrast studies for the benefit of patients.
Conflict of Interest
None declared.
-
References
- 1 Burusapat C, Jarungroongruangchai W, Charoenpitakchai M. Prognostic factors of cervical node status in head and neck squamous cell carcinoma. World J Surg Oncol 2015; 13: 51
- 2 Shah SB, Sharma S, D'Cruz AK. Head and neck oncology: the Indian scenario. South Asian J Cancer 2016; 5 (03) 104-105
- 3 Shanker N, Mathur P, Das P, Sathishkumar K, Martina Shalini AJ, Chaturvedi M. Cancer scenario in North-East India & need for an appropriate research agenda. Indian J Med Res 2021; 154 (01) 27-35
- 4 Miles KA. Tumour angiogenesis and its relation to contrast enhancement on computed tomography: a review. Eur J Radiol 1999; 30 (03) 198-205
- 5 Axel L. Cerebral blood flow determination by rapid-sequence computed tomography: theoretical analysis. Radiology 1980; 137 (03) 679-686
- 6 Sahani DV, Holalkere N-S, Mueller PR, Zhu AX. Advanced hepatocellular carcinoma: CT perfusion of liver and tumor tissue: initial experience. Radiology 2007; 243 (03) 736-743
- 7 Park M-S, Klotz E, Kim MJ. et al. Perfusion CT: noninvasive surrogate marker for stratification of pancreatic cancer response to concurrent chemo- and radiation therapy. Radiology 2009; 250 (01) 110-117
- 8 Bisdas S, Baghi M, Wagenblast J. et al. Differentiation of benign and malignant parotid tumors using deconvolution-based perfusion CT imaging: feasibility of the method and initial results. Eur J Radiol 2007; 64 (02) 258-265
- 9 Son E, Panwar A, Mosher CH, Lydiatt D. Cancers of the major salivary gland. J Oncol Pract 2018; 14 (02) 99-108
- 10 Petralia G, Bonello L, Viotti S, Preda L, d'Andrea G, Bellomi M. CT perfusion in oncology: how to do it. Cancer Imaging 2010; 10 (01) 8-19
- 11 Brooks DJ. Positron emission tomography and single-photon emission computed tomography in central nervous system drug development. NeuroRx 2005; 2 (02) 226-236
- 12 Sathishkumar K, Chaturvedi M, Das P, Stephen S, Mathur P. Cancer incidence estimates for 2022 & projection for 2025: result from National Cancer Registry Programme, India. Indian J Med Res 2022; 156 (4&5): 598-607
- 13 Petti S. Lifestyle risk factors for oral cancer. Oral Oncol 2009; 45 (4–5): 340-350
- 14 Neville BW, Day TA. Oral cancer and precancerous lesions. CA Cancer J Clin 2002; 52 (04) 195-215
- 15 Subapriya R, Thangavelu A, Mathavan B, Ramachandran CR, Nagini S. Assessment of risk factors for oral squamous cell carcinoma in Chidambaram, Southern India: a case-control study. Eur J Cancer Prev 2007; 16 (03) 251-256
- 16 Heck JE, Berthiller J, Vaccarella S. et al. Sexual behaviours and the risk of head and neck cancers: a pooled analysis in the International Head and Neck Cancer Epidemiology (INHANCE) consortium. Int J Epidemiol 2010; 39 (01) 166-181
- 17 Sankaranarayanan R, Black RJ, Swaminathan R, Parkin DM. An overview of cancer survival in developing countries. IARC Sci Publ 1998; (145) 135-173
- 18 Chaturvedi P. Head and neck surgery. J Can Res Ther 2009; 5: 143
- 19 Carroll T, Vora A. Standards of Care for Fanconi Anaemia affected Individuals and their Families. Edinburgh, UK: UK & Ireland Fanconi Anaemia Clinical Network; 2008
- 20 Bisdas S, Konstantinou GN, Lee PS. et al. Dynamic contrast-enhanced CT of head and neck tumors: perfusion measurements using a distributed-parameter tracer kinetic model. Initial results and comparison with deconvolution-based analysis. Phys Med Biol 2007; 52 (20) 6181-6196
- 21 Baruah C. et al Efficacy of Multislice CT Perfusion in Post Therapy Assessment of Nasopharyngeal Carcinoma — A Prospective Study in a Tertiary Care Institute. . International Journal of Biomedical and Advance Research 2021:e5553
- 22 Preda L, Calloni SF, Moscatelli MEM, Cossu Rocca M, Bellomi M. Role of CT perfusion in monitoring and prediction of response to therapy of head and neck squamous cell carcinoma. BioMed Res Int 2014; 2014: 917150
- 23 Trojanowska A. Squamous cell carcinoma of the head and neck: the role of diffusion and perfusion imaging in tumor recurrence and follow-up. Rep Pract Oncol Radiother 2011; 16 (06) 207-212
- 24 Alzimami K. et al. Effective radiation doses in neck computed tomography scans. Radiat Phys Chem 2022; 200: 110340
- 25 Deak Z, Schuettoff L, Lohse AK. et al. Reduction in radiation exposure of CT perfusion by optimized imaging timing using temporal information of the preceding CT angiography of the carotid artery in the stroke protocol. Diagnostics (Basel) 2022; 12 (11) 11
- 26 Sharma TD, Singh TT, Laishram RS, Sharma LDC, Sunita AK, Imchen LT. Nasopharyngeal carcinoma: a clinico-pathological study in a regional cancer centre of northeastern India. Asian Pac J Cancer Prev 2011; 12 (06) 1583-1587
- 27 Ding S, Guo W, Yin G. et al. Clinical study of poorly differentiated head and neck squamous cell carcinoma: a prospective cohort study in China. Ann Transl Med 2022; 10 (12) 703
- 28 Argiris A, Karamouzis MV, Raben D, Ferris RL. Head and neck cancer. Lancet 2008; 371 (9625) 1695-1709
- 29 Oren N, Vaysberg A, Ginat DT. Updated WHO nomenclature of head and neck lesions and associated imaging findings. Insights Imaging 2019; 10 (01) 72
- 30 Gormley M, Creaney G, Schache A, Ingarfield K, Conway DI. Reviewing the epidemiology of head and neck cancer: definitions, trends and risk factors. Br Dent J 2022; 233 (09) 780-786
- 31 Cao X, Song J, Xu J. et al. Tumor blood flow is a predictor of radiotherapy response in patients with nasopharyngeal carcinoma. Front Oncol 2021; 11: 567954
- 32 Hayano K, Shuto K, Koda K, Yanagawa N, Okazumi S, Matsubara H. Quantitative measurement of blood flow using perfusion CT for assessing clinicopathologic features and prognosis in patients with rectal cancer. Dis Colon Rectum 2009; 52 (09) 1624-1629
- 33 d'Assignies G, Couvelard A, Bahrami S. et al. Pancreatic endocrine tumors: tumor blood flow assessed with perfusion CT reflects angiogenesis and correlates with prognostic factors. Radiology 2009; 250 (02) 407-416
- 34 Ash L, Teknos TN, Gandhi D, Patel S, Mukherji SK. Head and neck squamous cell carcinoma: CT perfusion can help noninvasively predict intratumoral microvessel density. Radiology 2009; 251 (02) 422-428
Address for correspondence
Publication History
Article published online:
11 December 2024
© 2024. Indian Radiological Association. This is an open access article published by Thieme under the terms of the Creative Commons Attribution-NonDerivative-NonCommercial License, permitting copying and reproduction so long as the original work is given appropriate credit. Contents may not be used for commercial purposes, or adapted, remixed, transformed or built upon. (https://creativecommons.org/licenses/by-nc-nd/4.0/)
Thieme Medical and Scientific Publishers Pvt. Ltd.
A-12, 2nd Floor, Sector 2, Noida-201301 UP, India
-
References
- 1 Burusapat C, Jarungroongruangchai W, Charoenpitakchai M. Prognostic factors of cervical node status in head and neck squamous cell carcinoma. World J Surg Oncol 2015; 13: 51
- 2 Shah SB, Sharma S, D'Cruz AK. Head and neck oncology: the Indian scenario. South Asian J Cancer 2016; 5 (03) 104-105
- 3 Shanker N, Mathur P, Das P, Sathishkumar K, Martina Shalini AJ, Chaturvedi M. Cancer scenario in North-East India & need for an appropriate research agenda. Indian J Med Res 2021; 154 (01) 27-35
- 4 Miles KA. Tumour angiogenesis and its relation to contrast enhancement on computed tomography: a review. Eur J Radiol 1999; 30 (03) 198-205
- 5 Axel L. Cerebral blood flow determination by rapid-sequence computed tomography: theoretical analysis. Radiology 1980; 137 (03) 679-686
- 6 Sahani DV, Holalkere N-S, Mueller PR, Zhu AX. Advanced hepatocellular carcinoma: CT perfusion of liver and tumor tissue: initial experience. Radiology 2007; 243 (03) 736-743
- 7 Park M-S, Klotz E, Kim MJ. et al. Perfusion CT: noninvasive surrogate marker for stratification of pancreatic cancer response to concurrent chemo- and radiation therapy. Radiology 2009; 250 (01) 110-117
- 8 Bisdas S, Baghi M, Wagenblast J. et al. Differentiation of benign and malignant parotid tumors using deconvolution-based perfusion CT imaging: feasibility of the method and initial results. Eur J Radiol 2007; 64 (02) 258-265
- 9 Son E, Panwar A, Mosher CH, Lydiatt D. Cancers of the major salivary gland. J Oncol Pract 2018; 14 (02) 99-108
- 10 Petralia G, Bonello L, Viotti S, Preda L, d'Andrea G, Bellomi M. CT perfusion in oncology: how to do it. Cancer Imaging 2010; 10 (01) 8-19
- 11 Brooks DJ. Positron emission tomography and single-photon emission computed tomography in central nervous system drug development. NeuroRx 2005; 2 (02) 226-236
- 12 Sathishkumar K, Chaturvedi M, Das P, Stephen S, Mathur P. Cancer incidence estimates for 2022 & projection for 2025: result from National Cancer Registry Programme, India. Indian J Med Res 2022; 156 (4&5): 598-607
- 13 Petti S. Lifestyle risk factors for oral cancer. Oral Oncol 2009; 45 (4–5): 340-350
- 14 Neville BW, Day TA. Oral cancer and precancerous lesions. CA Cancer J Clin 2002; 52 (04) 195-215
- 15 Subapriya R, Thangavelu A, Mathavan B, Ramachandran CR, Nagini S. Assessment of risk factors for oral squamous cell carcinoma in Chidambaram, Southern India: a case-control study. Eur J Cancer Prev 2007; 16 (03) 251-256
- 16 Heck JE, Berthiller J, Vaccarella S. et al. Sexual behaviours and the risk of head and neck cancers: a pooled analysis in the International Head and Neck Cancer Epidemiology (INHANCE) consortium. Int J Epidemiol 2010; 39 (01) 166-181
- 17 Sankaranarayanan R, Black RJ, Swaminathan R, Parkin DM. An overview of cancer survival in developing countries. IARC Sci Publ 1998; (145) 135-173
- 18 Chaturvedi P. Head and neck surgery. J Can Res Ther 2009; 5: 143
- 19 Carroll T, Vora A. Standards of Care for Fanconi Anaemia affected Individuals and their Families. Edinburgh, UK: UK & Ireland Fanconi Anaemia Clinical Network; 2008
- 20 Bisdas S, Konstantinou GN, Lee PS. et al. Dynamic contrast-enhanced CT of head and neck tumors: perfusion measurements using a distributed-parameter tracer kinetic model. Initial results and comparison with deconvolution-based analysis. Phys Med Biol 2007; 52 (20) 6181-6196
- 21 Baruah C. et al Efficacy of Multislice CT Perfusion in Post Therapy Assessment of Nasopharyngeal Carcinoma — A Prospective Study in a Tertiary Care Institute. . International Journal of Biomedical and Advance Research 2021:e5553
- 22 Preda L, Calloni SF, Moscatelli MEM, Cossu Rocca M, Bellomi M. Role of CT perfusion in monitoring and prediction of response to therapy of head and neck squamous cell carcinoma. BioMed Res Int 2014; 2014: 917150
- 23 Trojanowska A. Squamous cell carcinoma of the head and neck: the role of diffusion and perfusion imaging in tumor recurrence and follow-up. Rep Pract Oncol Radiother 2011; 16 (06) 207-212
- 24 Alzimami K. et al. Effective radiation doses in neck computed tomography scans. Radiat Phys Chem 2022; 200: 110340
- 25 Deak Z, Schuettoff L, Lohse AK. et al. Reduction in radiation exposure of CT perfusion by optimized imaging timing using temporal information of the preceding CT angiography of the carotid artery in the stroke protocol. Diagnostics (Basel) 2022; 12 (11) 11
- 26 Sharma TD, Singh TT, Laishram RS, Sharma LDC, Sunita AK, Imchen LT. Nasopharyngeal carcinoma: a clinico-pathological study in a regional cancer centre of northeastern India. Asian Pac J Cancer Prev 2011; 12 (06) 1583-1587
- 27 Ding S, Guo W, Yin G. et al. Clinical study of poorly differentiated head and neck squamous cell carcinoma: a prospective cohort study in China. Ann Transl Med 2022; 10 (12) 703
- 28 Argiris A, Karamouzis MV, Raben D, Ferris RL. Head and neck cancer. Lancet 2008; 371 (9625) 1695-1709
- 29 Oren N, Vaysberg A, Ginat DT. Updated WHO nomenclature of head and neck lesions and associated imaging findings. Insights Imaging 2019; 10 (01) 72
- 30 Gormley M, Creaney G, Schache A, Ingarfield K, Conway DI. Reviewing the epidemiology of head and neck cancer: definitions, trends and risk factors. Br Dent J 2022; 233 (09) 780-786
- 31 Cao X, Song J, Xu J. et al. Tumor blood flow is a predictor of radiotherapy response in patients with nasopharyngeal carcinoma. Front Oncol 2021; 11: 567954
- 32 Hayano K, Shuto K, Koda K, Yanagawa N, Okazumi S, Matsubara H. Quantitative measurement of blood flow using perfusion CT for assessing clinicopathologic features and prognosis in patients with rectal cancer. Dis Colon Rectum 2009; 52 (09) 1624-1629
- 33 d'Assignies G, Couvelard A, Bahrami S. et al. Pancreatic endocrine tumors: tumor blood flow assessed with perfusion CT reflects angiogenesis and correlates with prognostic factors. Radiology 2009; 250 (02) 407-416
- 34 Ash L, Teknos TN, Gandhi D, Patel S, Mukherji SK. Head and neck squamous cell carcinoma: CT perfusion can help noninvasively predict intratumoral microvessel density. Radiology 2009; 251 (02) 422-428