

Subscribe to RSS
DOI: 10.3415/VCOT-16-12-0172
Effect of Limb Position at the Time of Skin Marker Application on Sagittal Plane Kinematics of the Dog
Authors
Address for correspondence
Publication History
received
30 December 2016
accepted after revision
13 June 2017
Publication Date:
04 December 2017 (online)

Abstract
Objectives To evaluate the effect of limb position during initial skin marker application on sagittal plane kinematics of the hindlimb.
Methods Six healthy dogs (20–30 kg) were evaluated. An established two-dimensional kinematic model of the pelvic limb was utilized to describe sagittal plane motion. Kinematic markers were applied separately for each dog while standing in three different positions: (1) the limb extended cranially, (2) a normal standing limb position and (3) the limb extended caudally. Following marker application at each of the three positions, dynamic gait was recorded at a walk (velocity, 0.9–1.2 m/s; acceleration, 0.5m/s2). Five valid trials were used for comparison. Complete waveform analysis was performed with generalized indicator function analysis (GIFA). Maximum and minimum joint angles and joint range of motion were compared with a one-way repeated measures ANOVA with significance at p < 0.05.
Results Significant differences were found between stifle waveforms. No differences were found between the hip or tarsus waveforms. Minimum and maximum joint angles were significantly different for the hip and stifle but not for the tarsus. No differences were found between ranges of motion for any joint evaluated.
Clinical Significance Limb position at the time of skin marker application affects gait data and is an important consideration for kinematic analysis of the hindlimb in dogs.
Introduction
Computer-assisted kinematic analysis has been used to characterize gait patterns in animals with musculoskeletal pathology.[1]–[7] Although there are different kinematic analysis systems available, video-based motion analysis using superficial skin markers is the most commonly reported method of kinematic data acquisition of the hindlimb in dogs.[1]–[6],[8],[9]
DeCamp and colleagues described a two-dimensional kinematic model of the hindlimb in dogs, most commonly used to describe sagittal plane motion. This model has been widely used to date[1]–[6],[10],[11] and uses superficial skin markers placed over anatomical landmarks for easy identification and repeatable placement. Nevertheless, previous reports have suggested that inconsistent marker placement or marker placement error can result invariability in joint kinematics in the hindlimb.[1],[2],[4],[5] Furthermore, recent research has shown that the direction of marker placement error can affect the magnitude of detectable differences in kinematic data.[12] What is less apparent are factors leading to erroneous marker placement. Currently, there are not any uniform guidelines regarding how to position a dog at the time of marker placement, and the effect of limb position at the time of marker application is unknown.
The purpose of the study reported here was to evaluate the effect of hindlimb position at the time of marker application on sagittal plane kinematics of the hindlimb in the dog. Our hypothesis was that changes in limb position at the time of marker application would result in detectable differences in kinematic data obtained from dogs at a walk.
Materials and Methods
Animals
Six adult hound-breed dogs (three males and three females) from an established research colony were evaluated in this study. All dogs were 2 to 3 years of age and weighed 20 to 30 kg. All dogs had normal bilateral hip and stifle radiographs, force plate analysis, haematology, serum chemistry and physical examinations prior to study initiation. The dogs were housed indoors in a climate-controlled environment and fed commercial dog food ad libitum. Kinematic analysis protocol in this study was approved by the University of Georgia Institutional Animal Care and Use Committee.
Spherical retroreflective markers (10 mm in diameter) were used to develop all kinematic models. All dogs were shorthaired and hair was not clipped prior to marker application. Markers were affixed to the skin with double-sided tape and cyanoacrylate. A three-dimensional testing space was established on a 13-m walkway. Right-handed orthogonal coordinate axes were employed to describe the testing space in three dimensions with 0,0,0 (X,Y,Z) located in the centre of the testing space. Prior to each day’s collection, the system was calibrated with a calibration frame of known dimensions (Vicon Peak Motus L-Frame, Vicon-Peak, Centennial, Colorado, United States) and by dynamic linearization with a custom-made 0.700-m wand. Marker locations were captured by a kinematic system of six infrared cameras (Vicon MX03, Vicon Motion Systems, Inc., Centennial, Colorado, United States) arranged around the gait platform. Data were recorded and analysed by a motion-analysis program (Peak Motus 9.2; Vicon Motion Systems).
Right hindlimb kinematic data were collected from all dogs moving through the calibrated space at a walk (velocity: 0.9–1.2 m/s;acceleration: ± 0.5m/s2). Truncal velocity and acceleration were recorded with a series of five photocells placed 0.5 m apart and 0.5 m above the walkway. The first five valid trials were utilized for analysis. All dogs were from an established research colony and as such were habituated to the testing facility.
Kinematic Model
A sagittal plane kinematic model of the hindlimb in dogs was utilized in this study, as previously described.[5],[10],[11] Five retroreflective markers (10 mm in diameter) were attached over anatomical landmarks of the right hindlimb: the iliac crest, greater trochanter of the femur, the femorotibial joint between the lateral epicondyle of the femur and the fibular head, the lateral malleolus of the tibia and the distolateral aspect of the fifth metatarsal bone. All skin markers were placed by the same experienced investigator (SK) throughout the study.
Data Collection
The kinematic models were established separately for each dog while standing in three different positions: (1) the limb extended cranially with the foot cranial to the pelvis (cranial), (2) the limb in a neutral position with the foot beneath the pelvis (normal) and (3) the limb extended caudally with the foot caudal to the pelvis (caudal;[Fig. 1]). Kinematic data collection was performed separately for all limb positions (cranial, normal and caudal) during the same testing period. The sagittal plane kinematic model of the hindlimb was established in one of the standing positions, randomly assigned for each dog prior to study initiation.[3] Following marker application, dynamic gait analysis was performed and five valid kinematic trials were obtained for comparison. All markers were then removed with acetone, leaving no visible trace. The investigator then positioned the dogs’ hindlimbs in the second randomly selected position and repeated the above procedure. This was performed in a similar manner for the third and final hindlimb position. Five valid trials from each of the three initial standing positions were collected for each dog and were used for kinematic analysis. A valid trial included a straight, forward walk with no interruption or overt head movement. Throughout the study, all dogs were walked by the same experienced handler.

Data Analysis
Sagittal (flexion and extension) plane kinematics for the hip, stifle and tarsus were generated and collected from each dog during a walk, separately for each of the three initial standing positions. Complete waveform analysis was performed with Generalized Indicator Function Analysis (GIFA) as previously described.[13],[14] All hypothesis tests were two sided and significance was set at p < 0.05. Kinematic variables, including joint range of motion and minimum and maximum joint excursions were determined. Comparison between values obtained at different initial standing positions was performed with one-way repeated measures analysis of variance (ANOVA) with Greenhouse–Geisser correction. Post hoc pairwise comparison between the hindlimb positions was performed with a Bonferroni adjustment. Normality was determined with the Shapiro–Wilk test. Statistical significance was set at p < 0.05. The statistical analysis was performed with standard statistical software (SPSS 16.0: Statistical Package for Social Science, Inc., Chicago, Illinois, United States).
Results
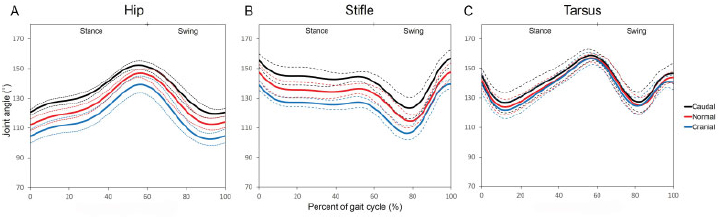
Sagittal (flexion and extension) plane waveforms were generated for the hip, stifle and tarsus for all three initial standing positions and were compiled graphically with 95% confidence intervals ([Fig. 2]). The mean (±SD) values for range of motion and minimum/maximum joint angles of the hip, stifle and tarsal joints were determined for all three hindlimb positions (cranial, below, caudal) during marker application ([Table 1]).
|
Hip |
Stifle |
Tarsus |
|||||||
|---|---|---|---|---|---|---|---|---|---|
|
Max |
Min |
ROM |
Max |
Min |
ROM |
Max |
Min |
ROM |
|
|
Cranial |
140.0 ± 6.9[a] |
102.3 ± 5.1[a] |
37.7 ± 5.8 |
140.56 ±4.1[a] |
105.36 ± 5.1[a] |
35.26 ± 7.9 |
157.46 ± 5.2 |
119.76 ± 6.5 |
37.86 ± 6.6 |
|
Normal |
111.1 ±4.4[b] |
36.5 ± 4.0 |
148.06 ± 7.3[a] |
113.86 ±4.3[b] |
34.36 ± 7.3 |
158.36 ± 3.4 |
121.26 ± 6.6 |
37.16 ±4.7 |
|
|
Caudal |
152.3 ± 3.3[b] |
118.9 ± 3.2[c] |
33.6 ±4.9 |
157.46 ± 7.2[b] |
122.56 ± 8.1[c] |
34.96 ± 5.5 |
160.06 ±4.8 |
124.36 ± 8.8 |
35.66 ± 5.7 |
|
p value |
< 0.01 |
< 0.01 |
0.21 |
< 0.01 |
< 0.01 |
0.64 |
0.69 |
0.88 |
0.55 |
Each hindlimb positions generated grossly similar waveform shapes. However, when markers were applied to the limb in the different standing positions, a vertical shift of the waveform occurred. The direction of the shift was consistent for all joints with the cranial standing position resulting in a downward shift and a caudal standing position resulting in an upward shift of the waveform, as compared with the normal standing position. The magnitude of this shift was least in the tarsus ([Fig. 2]).
Complete Waveform Analysis
GIFA found no significant difference between the waveforms from the hip and tarsus. Significant differences were found between stifle waveforms obtained at different initial standing positions.
Kinematic Variables
Significant differences were found in the maximum and minimum joint angles of the hip and stifle between the different initial standing positions ([Table 1]). No differences were found between the minimum and maximum joint angles of the tarsus. In all joints, the caudal standing position produced the largest angular values, followed by the normal standing position, and then the cranial standing position produced the smallest angular values. No differences were found in joint range of motion in all joints for all three initial standing angles.
Discussion
The hypothesis in this study was supported. Different hindlimb positions at the time of marker placement influenced sagittal joint angles of the hip and the stifle during walking. Interestingly, the effect of the hindlimb positions on the tarsal joint was negligible. While the wave for mshapes were visually similar for all hindlimb positions at the time of marker placement, differences were detected between the stifle waveforms.
A vertical shift of the gait waveforms was found in the data obtained at different initial standing positions. Subsequent to this shift, a change in the extreme values of joint motion was noted. However, when the overall range of values was evaluated, no differences were noted. This indicates that while differences in initial positioning alter the specific values along the gait waveform, the average measure of motion throughout the complete gait cycle is unaffected. Shifting of the waveforms along the vertical axis has been documented in previous studies where changes in marker placement were cited as the underlying cause.[1],[5],[12],[15] Marker placement over osseous anatomical landmarks is commonly performed to increase consistency and reduce underlying soft tissue.[1],[5],[10] However, recent studies found that even when markers were placed over bone landmarks, significant skin motion occurs.[11],[16] In those studies, the primary emphasis was on monitoring skin motion following marker placement. In this study, the focus was instead on the effect of bone movement relative to skin prior to marker application. Because the same investigator placed all markers over easily palpable bone landmarks, the shifting of the waveforms is likely due to a shifting of the bone underneath the skin during initial limb positioning at the time of marker application.
Two-dimensional linkage kinematic models, as used in this study, are by design just interconnected lines between estimated joint centres. Because of this, it is not surprising that small changes in marker position resulted in changes to the measured joint angles–essentially establishing a more acute or obtuse angular measurement. With the foot positioned caudal to the pelvis, the hip and tarsus are extended (more obtuse angle) and with the foot placed cranial to the pelvis, the hip and tarsus are flexed (more acute angle). Consequently, skin markers placed while the hip was in extension shifted waveforms of hip and stifle angles up along the y-axis, and markers placed during the hip flexion shifted the waveforms down along the y-axis ([Fig. 2A, B]). In humans, it has been reported that with hip extension the greater trochanter is located more cranially, and with hip flexion it is located more caudally.[17],[18] Interestingly, this is the first report in dogs to evaluate the effect of bone landmark positioning, in relation to skin, at the time of marker application. Previous veterinary studies have discussed and evaluated marker placement errors with no attention to limb or bone positioning at the time of marker placement.[1],[2],[4],[5],[12] One such study on dogs examined stifle kinematics based on alternate greater trochanter locations established with the dogs standing with identical limb positioning.[12] In that study, cranial deviation of the greater trochanter marker shifted the waveform of the stifle angle up, and caudal deviation of the marker shifted the waveform down the y-axis. Those findings as well as the current results in this study indicate that it is not only marker application error that can lead to kinematic data variability, but also inconsistent limb positioning during marker application. Therefore, consistent limb positioning at the time of marker application is an important consideration in kinematic studies.
Tarsal angles were not significantly affected by limb position during marker application. The reason for these findings may be related to inherent differences in the marker locations used to define tarsal motion (lateral femoral condyle, lateral malleolus and distolateral aspect of the fifth metatarsal bone). Previous studies found that while skin motion occurs in a cyclical pattern, there is a directional component of motion that is marker dependent.[11],[16] In those studies, the lateral femoral condyle marker moved in a similar direction to the long axis of the tibia, resulting in a change in the overall length of the tibial segment.[11],[16] However, because of this unique directional change of the lateral femoral condyle marker, skin motion results in a minimal overall change in the angular measurement of the tarsus.[11] Furthermore, markers placed on the lateral malleolus and distolateral aspect of the fifth meta-tarsal bone are in anatomical locations with minimal underlying soft tissue–resulting in reduced skin motion artefact and marker placement error.
Marker placement error in kinematic analysis has been associated with a vertical shift in the gait waveform, as seen in this study.[1],[5],[12],[15] In an effort to reduce the effect of this shift on kinematic analysis, normalization procedures have been described.[5] However, the normalization process alters the original data and may mask true differences between waveforms at different time points. Additionally, the normalization process can be time consuming and therefore may not be well suited for clinical use. Various methods have been introduced in dogs to avoid soft-tissue artefact or marker placement error and to directly analyse bone movement.[9],[19],[20] Unfortunately, such methods are only applicable in a research setting due to invasiveness, cost and speed of analysis. Regardless of clinical or research studies, the results of this study show the importance of limb position at the time of marker application. The use of a standardized limb position during marker application will reduce kinematic data variability in both clinical and research studies.
Analysis of kinematic gait data has been performed with various methodologies. Historically, Fourier analysis has been a common method used to compare joint angle waveforms from dogs.[1],[4],[5],[15] In this study, GIFA was used to compare shapes of waveforms of joint angles as described in recent studies.[12],[15],[21] These proved beneficial because unlike Fourier analysis, which is affected by the vertical position of the gait waveforms, GIFA compares the true waveform shapes and is unaffected by the position of the gait waveforms along the vertical axis.[13]–[15],[21] In addition to waveform analysis, comparison of peak joint angles and ranges of motion was performed as previously described.[10],[11],[19],[22],[23] In this study, one-way repeated measures ANOVA allowed comparison between different hindlimb positions within a subject and avoided the obscuring caused by averaging all values, as has been seen in previous studies using only Fourier analysis.[5],[7]
Numerous sources of variability in kinematic gait analysis have been identified. Recent research has documented that there are inter-examiner variability and intra-examiner variability between testing days in the kinematic analysis of the stifle.[15] To avoid inter-examiner variability in the current study, all markers were applied by a single experienced examiner. To reduce intra-examiner variability in marker placement between days as well as to avoid true gait changes between days, all kinematic data were collected during the same testing period for individual dogs.[24] Also, the same dog handler walked all dogs in a narrow range of velocity to prevent possible interference with gait attributable to behaviour response to the handler.
Limitations of this study include the small number of dogs. Additionally, while the results of this study and previous studies indicate that different hindlimb positions contribute to the variation of the skin marker placement, this study did not measure actual differences in individual marker locations resulting from different hindlimb positions. This study still showed how kinematic data are affected by limb position during marker placement. Further research is warranted to characterize skin marker placement during various body postures.
Overall, the results of this study show that sagittal plane kinematic data were affected by hindlimb position at the time of marker application. Additionally, with the kinematic model utilized in this study the direction of shift in the gait waveforms for all joints was consistent for the cranial and caudal limb positions. Consistent, standardized positioning during marker placement is important to reduce variability necessary for clinical gait analysis such as kinematics and inverse dynamics.
Conflict of Interest
The authors have no conflicts of interest, financial or otherwise, to report.
All authors were responsible for the study conception and design, as well as the data aquisition, analysis, drafting, and revising the manuscript.
-
References
- 1 Bennett RL, DeCamp CE, Flo GL, Hauptman JG, Stajich M. Kinematic gait analysis in dogs with hip dysplasia. Am J Vet Res 1996; 57 (07) 966-971.
- 2 Bockstahler BA, Prickler B, Lewy E, Holler PJ, Vobornik A, Peham C. Hind limb kinematics during therapeutic exercises in dogs with osteoarthritis of thehipjoints. Am J Vet Res 2012; 73 (09) 1371-1376.
- 3 Bush MA, Sibley P, Owen MA, Burton NJ, Owen MR, Colborne GR. Inverse dynamics analysis evaluation of tibial tuberosity advancement for cranial cruciate ligament failure in dogs. Vet Surg 2012; 41 (04) 471-481.
- 4 DeCamp CE, Riggs CM, Olivier NB, Hauptman JG, Hottinger HA, Soutas-Little RW. Kinematic evaluation of gait in dogs with cranial cruciate ligament rupture. Am J Vet Res 1996; 57 (01) 120-126.
- 5 DeCamp CE, Soutas-Little RW, Hauptman J, Olivier B, Braden T, Walton A. Kinematic gait analysis of the trot in healthy greyhounds. Am J Vet Res 1993; 54 (04) 627-634.
- 6 Drüen S, Böddeker J, Meyer-Lindenberg A, Fehr M, Nolte I, Wefstaedt P. Computer-based gait analysis of dogs: evaluation of kinetic and kinematic parameters after cemented and cementless total hip replacement. Vet Comp Orthop Traumatol 2012; 25 (05) 375-384.
- 7 Hottinger HA, DeCamp CE, Olivier NB, Hauptman JG, Soutas-Little RW. Noninvasive kinematic analysis of the walk in healthy large-breed dogs. Am J Vet Res 1996; 57 (03) 381-388.
- 8 Jones SC, Kim SE, Banks SA. et al. Accuracy of noninvasive, single-plane fluoroscopic analysis for measurement of three-dimensional femorotibial joint poses in dogs treated by tibial plateau leveling osteotomy. Am J Vet Res 2014; 75 (05) 486-493.
- 9 Korvick DL, Pijanowski GJ, Schaeffer DJ. Three-dimensional kinematics of the intact and cranial cruciate ligament-deficient stifle of dogs. J Biomech 1994; 27 (01) 77-87.
- 10 Kim J, Rietdyk S, Breur GJ. Comparison of two-dimensional and three-dimensional systems for kinematic analysis of the sagittal motion of canine hind limbs during walking. Am J Vet Res 2008; 69 (09) 1116-1122.
- 11 Kim SY, Kim JY, Hayashi K, Kapatkin AS. Skin movement during the kinematic analysis of the canine pelvic limb. Vet Comp Orthop Traumatol 2011; 24 (05) 326-332.
- 12 Torres BT, Whitlock D, Reynolds LR. et al. The effect of marker location variability on noninvasive canine stifle kinematics. Vet Surg 2011; 40 (06) 715-719.
- 13 Torres BT, Punke JP, Fu YC. et al. Comparison of canine stifle kinematic data collected with three different targeting models. Vet Surg 2010; 39 (04) 504-512.
- 14 Yokoo T, Knight BW, Sirovich L. An optimization approach to signal extraction from noisy multivariate data. Neuroimage 2001; 14 (06) 1309-1326.
- 15 Torres BT, Gilbert PJ, Reynolds LR. et al. The Effect of Examiner Variability on Multiple Canine Stifle Kinematic Gait Collections in a 3-Dimensional Model. Vet Surg 2015; 44 (05) 581-587.
- 16 Schwencke M, Smolders LA, Bergknut N, Gustås P, Meij BP, Hazewinkel HA. Soft tissue artifact in canine kinematic gait analysis. Vet Surg 2012; 41 (07) 829-837.
- 17 Cappozzo A, Catani F, Leardini A, Benedetti MG, Croce UD. Position and orientation in space of bones during movement: experimental artefacts. Clin Biomech (Bristol, Avon) 1996; 11 (02) 90-100.
- 18 Leardini A, Chiari L, Della Croce U, Cappozzo A. Human movement analysis using stereophotogrammetry. Part 3. Soft tissue artifact assessment and compensation. Gait Posture 2005; 21 (02) 212-225.
- 19 Kim SE, Jones SC, Lewis DD. et al. In-vivo three-dimensional knee kinematics during dailyactivities in dogs. J Orthop Res 2015; 33 (11) 1603-1610.
- 20 Tashman S, Anderst W, Kolowich P, Havstad S, Arnoczky S. Kinematics of the ACL-deficient canine knee during gait: serial changes over two years. J Orthop Res 2004; 22 (05) 931-941.
- 21 Al-Nadaf S, Torres BT, Budsberg SC. Comparison of two methods for analyzing kinetic gait data in dogs. Am J Vet Res 2012; 73 (02) 189-193.
- 22 Hogy SM, Worley DR, Jarvis SL, Hill AE, Reiser II RF, Haussler KK. Kinematic and kinetic analysis of dogs during trotting after amputation of a pelvic limb. Am J Vet Res 2013; 74 (09) 1164-1171.
- 23 Jarvis SL, Worley DR, Hogy SM, Hill AE, Haussler KK, Reiser II RF. Kinematic and kinetic analysis of dogs during trotting after amputation of a thoracic limb. Am J Vet Res 2013; 74 (09) 1155-1163.
- 24 Nordquist B, Fischer J, Kim SY. et al. Effects of trial repetition, limb side, intraday and inter-week variation on vertical and cranio-caudal ground reaction forces in clinically normal Labrador Retrievers. Vet Comp Orthop Traumatol 2011; 24 (06) 435-444.
Address for correspondence
-
References
- 1 Bennett RL, DeCamp CE, Flo GL, Hauptman JG, Stajich M. Kinematic gait analysis in dogs with hip dysplasia. Am J Vet Res 1996; 57 (07) 966-971.
- 2 Bockstahler BA, Prickler B, Lewy E, Holler PJ, Vobornik A, Peham C. Hind limb kinematics during therapeutic exercises in dogs with osteoarthritis of thehipjoints. Am J Vet Res 2012; 73 (09) 1371-1376.
- 3 Bush MA, Sibley P, Owen MA, Burton NJ, Owen MR, Colborne GR. Inverse dynamics analysis evaluation of tibial tuberosity advancement for cranial cruciate ligament failure in dogs. Vet Surg 2012; 41 (04) 471-481.
- 4 DeCamp CE, Riggs CM, Olivier NB, Hauptman JG, Hottinger HA, Soutas-Little RW. Kinematic evaluation of gait in dogs with cranial cruciate ligament rupture. Am J Vet Res 1996; 57 (01) 120-126.
- 5 DeCamp CE, Soutas-Little RW, Hauptman J, Olivier B, Braden T, Walton A. Kinematic gait analysis of the trot in healthy greyhounds. Am J Vet Res 1993; 54 (04) 627-634.
- 6 Drüen S, Böddeker J, Meyer-Lindenberg A, Fehr M, Nolte I, Wefstaedt P. Computer-based gait analysis of dogs: evaluation of kinetic and kinematic parameters after cemented and cementless total hip replacement. Vet Comp Orthop Traumatol 2012; 25 (05) 375-384.
- 7 Hottinger HA, DeCamp CE, Olivier NB, Hauptman JG, Soutas-Little RW. Noninvasive kinematic analysis of the walk in healthy large-breed dogs. Am J Vet Res 1996; 57 (03) 381-388.
- 8 Jones SC, Kim SE, Banks SA. et al. Accuracy of noninvasive, single-plane fluoroscopic analysis for measurement of three-dimensional femorotibial joint poses in dogs treated by tibial plateau leveling osteotomy. Am J Vet Res 2014; 75 (05) 486-493.
- 9 Korvick DL, Pijanowski GJ, Schaeffer DJ. Three-dimensional kinematics of the intact and cranial cruciate ligament-deficient stifle of dogs. J Biomech 1994; 27 (01) 77-87.
- 10 Kim J, Rietdyk S, Breur GJ. Comparison of two-dimensional and three-dimensional systems for kinematic analysis of the sagittal motion of canine hind limbs during walking. Am J Vet Res 2008; 69 (09) 1116-1122.
- 11 Kim SY, Kim JY, Hayashi K, Kapatkin AS. Skin movement during the kinematic analysis of the canine pelvic limb. Vet Comp Orthop Traumatol 2011; 24 (05) 326-332.
- 12 Torres BT, Whitlock D, Reynolds LR. et al. The effect of marker location variability on noninvasive canine stifle kinematics. Vet Surg 2011; 40 (06) 715-719.
- 13 Torres BT, Punke JP, Fu YC. et al. Comparison of canine stifle kinematic data collected with three different targeting models. Vet Surg 2010; 39 (04) 504-512.
- 14 Yokoo T, Knight BW, Sirovich L. An optimization approach to signal extraction from noisy multivariate data. Neuroimage 2001; 14 (06) 1309-1326.
- 15 Torres BT, Gilbert PJ, Reynolds LR. et al. The Effect of Examiner Variability on Multiple Canine Stifle Kinematic Gait Collections in a 3-Dimensional Model. Vet Surg 2015; 44 (05) 581-587.
- 16 Schwencke M, Smolders LA, Bergknut N, Gustås P, Meij BP, Hazewinkel HA. Soft tissue artifact in canine kinematic gait analysis. Vet Surg 2012; 41 (07) 829-837.
- 17 Cappozzo A, Catani F, Leardini A, Benedetti MG, Croce UD. Position and orientation in space of bones during movement: experimental artefacts. Clin Biomech (Bristol, Avon) 1996; 11 (02) 90-100.
- 18 Leardini A, Chiari L, Della Croce U, Cappozzo A. Human movement analysis using stereophotogrammetry. Part 3. Soft tissue artifact assessment and compensation. Gait Posture 2005; 21 (02) 212-225.
- 19 Kim SE, Jones SC, Lewis DD. et al. In-vivo three-dimensional knee kinematics during dailyactivities in dogs. J Orthop Res 2015; 33 (11) 1603-1610.
- 20 Tashman S, Anderst W, Kolowich P, Havstad S, Arnoczky S. Kinematics of the ACL-deficient canine knee during gait: serial changes over two years. J Orthop Res 2004; 22 (05) 931-941.
- 21 Al-Nadaf S, Torres BT, Budsberg SC. Comparison of two methods for analyzing kinetic gait data in dogs. Am J Vet Res 2012; 73 (02) 189-193.
- 22 Hogy SM, Worley DR, Jarvis SL, Hill AE, Reiser II RF, Haussler KK. Kinematic and kinetic analysis of dogs during trotting after amputation of a pelvic limb. Am J Vet Res 2013; 74 (09) 1164-1171.
- 23 Jarvis SL, Worley DR, Hogy SM, Hill AE, Haussler KK, Reiser II RF. Kinematic and kinetic analysis of dogs during trotting after amputation of a thoracic limb. Am J Vet Res 2013; 74 (09) 1155-1163.
- 24 Nordquist B, Fischer J, Kim SY. et al. Effects of trial repetition, limb side, intraday and inter-week variation on vertical and cranio-caudal ground reaction forces in clinically normal Labrador Retrievers. Vet Comp Orthop Traumatol 2011; 24 (06) 435-444.