

RSS-Feed abonnieren
DOI: 10.4338/ACI-2016-10-RA-0168
The Effects of Medication Alerts on Prescriber Response in a Pediatric Hospital
Autoren
Correspondence to
Publikationsverlauf
05. Oktober 2016
28. Februar 2017
Publikationsdatum:
21. Dezember 2017 (online)

Summary
Objective: More than 70% of hospitals in the United States have electronic health records (EHRs). Clinical decision support (CDS) presents clinicians with electronic alerts during the course of patient care; however, alert fatigue can influence a provider’s response to any EHR alert. The primary goal was to evaluate the effects of alert burden on user response to the alerts.
Methods: We performed a retrospective study of medication alerts over a 24-month period (1/2013–12/2014) in a large pediatric academic medical center. The institutional review board approved this study. The primary outcome measure was alert salience, a measure of whether or not the prescriber took any corrective action on the order that generated an alert. We estimated the ideal number of alerts to maximize salience. Salience rates were examined for providers at each training level, by day of week, and time of day through logistic regressions.
Results: While salience never exceeded 38%, 49 alerts/day were associated with maximal salience in our dataset. The time of day an order was placed was associated with alert salience (maximal salience 2am). The day of the week was also associated with alert salience (maximal salience on Wednesday). Provider role did not have an impact on salience.
Conclusion: Alert burden plays a role in influencing provider response to medication alerts. An increased number of alerts a provider saw during a one-day period did not directly lead to decreased response to alerts. Given the multiple factors influencing the response to alerts, efforts focused solely on burden are not likely to be effective.
Citation: Dexheimer JW, Kirkendall ES, Kouril M, Hagedorn PA, Minich T, Duan LL, Mahdi M, Szczesniak R, Spooner SA. The effects of medication alerts on prescriber response in a pediatric hospital. Appl Clin Inform 2017; 8: 491–501 https://doi.org/10.4338/ACI-2016-10-RA-0168
Keywords
Medical informatics - clinical decision support - inpatient (inpatient CPOE) - electronic health records and systems - alert fatigue - alerting1. Background And Significance
More than 70% of hospitals in the United States (US) have electronic health records (EHRs) [[1]], and US government incentives have encouraged additional adoption including clinical decision support (CDS) for providers [[2]–[5]]. During a typical day, clinicians caring for hospitalized patients are presented with numerous electronic alerts intended to provide CDS. These alerts may be simple [[6]] or complex reminder systems [[7]] and are generated from the data contained in the EHR; they are implemented to promote safety and improve patient care [[8]–[13]].
The use of CDS increases as more hospitals and physician offices install EHRs [[14]]. CDS is frequently implemented as an active alert and alerting systems have demonstrated improvement in clinical care [[11], [13], [15]]. Alerts can improve practitioner performance [[16]] and existing evidence supports integration with a computerized system [[17]]. CDS can span across the entire gamut of patient care from dose or route button reminders to medication alerts. Unfortunately user behavior, in which most users override the majority of alerts [[18]], suggests that the preponderance of electronic CDS alerts fail to inform decision-making or action. Alerts can be overridden for a myriad of reasons. Without direct observation and questioning of user actions, it is not clear if alerts are overridden because they are considered extraneous, too frequent, or are ineffective through design, implementation, or lack of fit with workflow [[19], [20]].
Medication ordering is accomplished through Computerized Provider Order Entry (CPOE). EHR systems with CPOE and effective CDS have shown potential for reducing the risk of drug-related harm [[21]–[27]]. CPOE generally incorporates one or more proprietary databases of drug dosing rules, as a guide and tool for physicians to reference. With so many rules, and a low specificity of these rules to a particular population, the result is an inundation of alerts being produced by the CPOE.
Medication alerts appear during order entry and include notifications of drug-drug interactions, medication allergies, dose warnings, drug-disease, and duplicate therapy orders. Pediatric drug dosing is more complex than in adult patients due to factors such as weight-based dosing, varying drug metabolism and physiology during development, and the increased off-label use of medications in children [[28]–[32]]. Decreasing inappropriate medication alerts can improve adherence to the remaining alerts [[33]]. Despite the importance of these alerts for patient care, they are frequently ignored [[34], [35]]; this high rate of ignoring alerts is often attributed to alert fatigue and is commonly reported by clinician prescribers [[19], [36]].
Data analysis can be used to automatically identify inappropriate alerts by examining the technical and clinical validity of CDS through techniques such as outlier or anomaly detection and pattern recognition [[18]]. At our institution up to 92% of the 28,000 visible medication alerts generated monthly did not result in change or annulment of the order, despite the fact that only 8% of medication orders generate visible alerts [[18]]. However, no optimal response to alert rate exists in the literature [[37]]. The alert burden on a provider can be defined as the number of alerts that are viewed during medication ordering. We measured alert salience, the extent to which the provider takes corrective actions in response to the presented alert. It is a measure that demonstrates the user actually noticed and heeded the alert and did not simply and reflexively override it. Alert salience is one readily available measure that can help improve our understanding of alert fatigue and can be calculated using data available in the EHR. We hypothesize that the alert salience [[18]] decreases as the number of alerts a user sees increases.
2. Objectives
Our objective was to retrospectively evaluate the effects of alert burden on provider salience. The secondary goals were to evaluate the effects of day of the week, time of day, and the provider role to the alert salience. We hypothesized that increased alert burden will lead to decreased salience.
3. Methods
3.1 Study design, setting, and participants
We performed a retrospective study of medication alerts over a 24-month period from January 2013 to December 2014 in our 628-bed, urban children’s hospital (Cincinnati Children’s Hospital Medical Center) with approximately 1.2 million patient encounters annually. We have a fully-integrated EHR (Epic®, Verona, Wisconsin) implemented in stages from 2007 to 2010, and all medication orders are electronic.
The medication decision support rules for high-risk and commonly prescribed medications at our institution were customized – all other medication rules were used as supplied by the third party vendor. Some alerts (low-risk drug-drug interactions, duplicate therapy warnings) are filtered and not shown to all users. As a safety measure, all alerts regardless of risk are displayed for the pharmacists.
The medication alerts are pop-up, interruptive alerts that fire after order entry and before the user enters their credentials to sign the orders. Each medication alert provides a reason (e.g., dose, duplicate therapy, drug-drug interaction) and lists out the associated order. Additional information is offered on why the alert fired through hyperlinks in the warning text. A user can remove or discontinue individual orders. Users can select either a drop-down reason for each individual alert, select a button that immediately overrides all warnings, select “override and accept” for all orders or select “cancel” and return to order entry. Filtered warnings are viewable by selecting a check-box to cascade the additional warnings. All alerts generated during the study period were included in the dataset and all providers who received a visible alert were included in the analysis. The study was approved by the institutional review board.
3.2 Outcome measures
The primary outcome measure was alert salience. Salience is a measure of user response to an alert and is defined as the number of alerts that led to order cancelation or modification divided by the total number of alerts presented to a user [[18]]. A cancelled order is when the user cancels the ordering process, presumptively to change the order in response to the alert or some other stimuli. This action allows the provider to go back into order entry to modify the medication order. Higher salience is associated with users modifying or cancelling orders in response to alerts and lower salience is associated with users overriding alert prompts the majority of the time. Independent variables, which were examined in statistical models as covariates, included provider role, categorized as resident, fellow, attending or nurse; day of week; time of day, a continuous variable depicting clock time; alert type, which was Drug-drug, Dose, Allergy or Other types.
3.3 Analysis
Continuous and categorical data were summarized as mean (SD) and n (%), respectively. Generalized scatter plot smoothing was performed to estimate the number of alerts associated with highest salience as a function of the number of alerts per provider per day [[38], p. 215]. A natural spline was used for the smoother with knots selected using the quantile method [[39]]. Regions of data with lower sample size, which may inhibit smoothing, were not included. Using the same smoothing approach for curve fitting, change in salience as a function of time was examined separately for providers at both resident and fellow levels of training from the first alert shown to the user for two years. We also examined how salience changed according to weekday and clock time by performing logistic regressions using generalized linear mixed models with random intercepts to account for repeated measurements of providers. Similarly, we modeled the probability that action was taken and included type of provider, season, year and type of alert as covariates; the interaction terms type of alert [Formel: ×] year and type of alert [Formel: ×] season were included. Covariate effects with P<0.05 were retained in final models. Each model comparison is reported as an odds ratio (OR) with corresponding 95% confidence interval (CI). Comparisons of effects with P < 0.01 from logistic regressions were considered statistically significant to adjust for multiple testing. Descriptive analyses and logistic regressions were implemented using SAS 9.3 (SAS Institute, Cary, NC). Scatterplot smoothing estimation was performed using R 3.2.0 (R Foundation for Statistical Computing, Vienna, Austria).
4. Results
During the study period, 4,575 providers wrote 3,812,689 orders (26.3% outpatient). These orders generated 562,799 medication order-related alerts that were presented to users (28.3% outpatient). Of the alerts presented to the users, 47.8% were for medication dosing, 17.2% were for drug allergies, and 32.7% were for drug-drug interactions. The total number of alerts of these three predominant types, the associated salience rate, and the total counts of overridden alerts are shown in ►[Table 1].
|
Alert Type |
Alerts Overridden or Modified |
Alerts Presented |
Salience rate (%)[*] |
|---|---|---|---|
|
Dose |
33,931 |
269,071 |
12.6 |
|
Allergy |
6,291 |
90,443 |
7.0 |
|
Drug-drug |
26,200 |
157,772 |
16.6 |
When grouping all medication alerts, the number of alerts per user per day associated with maximal salience was 49 alerts/day (salience: 38%) (►[Figure 1]). The x-axis represents the number of alerts per provider per day. The y-axis represents the salience. The solid line is the smooth function estimating the trend, and the dashed lines are the variability bands (standard error) around the estimate. Each open circle represents the estimated proportion of canceled or modified alerts out of the total number of alerts per day.

When the scatterplot smoothing was performed separately for each of the three main alert types, the estimated number of alerts that maximize dose alert salience is 22 (salience 19%), the estimated number of alerts that maximize allergy alert salience is 40 (salience 47%), and the estimated number of alerts that maximize drug-drug alert salience is 60 (salience 34%).
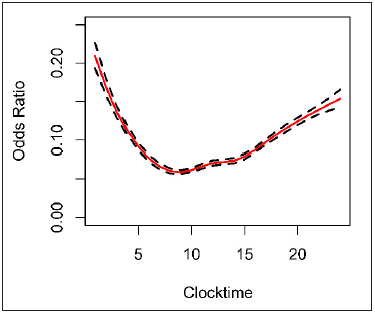
When plotting alert salience by time of day, a non-linear trend is evident with users altering orders based on alerts more frequently at midnight and least frequently at 0700 (►[Figure 2]). For every one-hour increase in clock time, we can see the salience probability change. The day of the week also had an effect on alert salience in the logistic regression model (P < 0.0001). Salience probability was highest on Fridays (predicted probability: 13%). Compared to Fridays, individuals were significantly less likely to modify orders on all other weekdays except Wednesdays and Sundays (►[Table 2]). Individuals were least likely to modify orders on Monday (predicted probability: 10.2%). The average number of alerts shown to providers by day of week are seen in ►[Table 3].
|
Variable |
OR |
95% CI |
P |
|---|---|---|---|
|
Weekday (Ref: Friday) |
|||
|
Saturday |
0.85 |
(0.82, 0.89) |
<0.0001 |
|
Sunday |
0.94 |
(0.90, 0.99) |
0.0145 |
|
Monday |
0.79 |
(0.75, 0.83) |
<0.0001 |
|
Tuesday |
0.93 |
(0.89, 0.97) |
0.0017 |
|
Wednesday |
0.97 |
(0.93, 1.02) |
0.22 |
|
Thursday |
0.86 |
(0.82, 0.90) |
<0.0001 |
|
Day of the Week |
Average Number of Alerts shown to providers/day |
Range |
Standard
|
|---|---|---|---|
|
Monday |
1218 |
435, 2747 |
266.86 |
|
Tuesday |
1119 |
309, 2563 |
222.08 |
|
Wednesday |
1200 |
290, 3051 |
269.43 |
|
Thursday |
1066 |
229, 1428 |
190.47 |
|
Friday |
1114 |
479, 1608 |
151.62 |
|
Saturday |
460 |
288, 639 |
75.25 |
|
Sunday |
429 |
271, 1044 |
104.93 |
Odds of cancelling an alert varied according to the type of alert, and season (P < 0.0001 and P = 0.0039, repsectively), but not by year. There was a statistically significant interaction between type of alert and season (P < 0.0001) as shown in ►[Figure 3]; however, the magnitude of this interaction was relatively small. Regardless of season, dose and drug-drug alerts each had higher odds of cancellation and modification, compared to drug-allergy alerts (respectively, OR: 2.09 and 2.36; 95% CI: [2.03, 2.15] and [2.29, 2.43]; both P < 0.0001). Dose alerts were slightly more likely to be cancelled or modified in Fall, compared to the Spring (OR: 1.11 [1.07, 1.15]), Summer (OR: 1.09 [1.06, 1.13]) and Winter (OR: 1.08 [1.04, 1.12]) (all P < 0.0001). On the other hand, drug-drug alerts were less likely to be cancelled or modified in Fall, compared to the Spring (OR: 0.84 [0.81, 0.87]), Summer (OR: 0.83 [0.80, 0.86]) and Winter (OR: 0.87 [0.83, 0.91]) (all P < 0.0001). Meanwhile, odds of canceling drug-allergy alerts were relatively stable, with Winter cancellation or modification being slightly higher than Summer cancellation (OR: 1.15 [1.07, 1.24]; P < 0.0001) (►[Figure 3]).

Provider role including attending physician, anesthesiologist, fellow, resident, pharmacist or registered nurse did not have an effect on alert salience. Resident providers had a relatively constant salience trend over time since start of residency (►[Figure 4]). Fellow physicians (additional training after residency) appeared to have a higher variability in salience throughout their fellowship (►[Figure 5]).


5. Disussion
In this study we demonstrated that alert burden does influence provider response to medication alerts (as measured by alert salience). In addition, we found that the time of day and day of the week influenced the salience to alerts. Using retrospective single site data, we have quantified these associations and other variables that may affect the acceptance of medication alert CDS.
There are many sociotechnical and human factors issues at play when considering why providers respond to alert suggestions [[26]]. Prescriber response to medication dosing alerts is a complex, poorly understood, and understudied phenomenon although alert fatigue and the poor performance of alerts are well-described phenomenon. Alert fatigue is a complex issue and it is therefore difficult to quantify all possible confounders. Clinicians are inundated with a large number of decision support alerts and evidence suggests that they begin to ignore alerts [[18]]. Some of the factors influencing alert fatigue can be attributed to two ideas: cognitive overload and desensitization [[40]]. The provider’s response to alerts decreases as the total number of simultaneous alerts increased [[11], [41]]. And repeated alerts that have a low sensitivity lead to a decline in response [[42]]. This work is an initial step towards identifying and addressing some of the potential causes of alert fatigue. We hope to improve alert salience based on these and prior published findings [[43], 44]. We believe that poor alert salience is a proxy to alert fatigue.
Previous work postulated that alert type and burden play a role in influencing provider reaction to medication alerts, most notably through the phenomenon of alert fatigue whereby users become unresponsive to alerts with increased exposure [[19], [20], 45]. Our analysis also shows that factors outside of alert burden, or the sheer number of alerts presented to users, appear to be associated with user response. In particular, time of day and day of week are associated with different user response rates. Based on these data, efforts focused solely on reducing alert burden may be effective but other factors need to be considered when improving our alerting system.
While the salience rates are quite low, they varied quite a bit across the different factors. A maximum burden of 49 is a curious and unexpected finding as it is higher than we anticipated. This is an unadjusted estimate that requires additional study; it is likely multifactorial in nature, related to the specific prescribing environment, and difficult to interpret in only one dimension. It is possible that certain types of providers tend to write orders that generate that number of alerts – they tend to depend more on the CDS than other prescribers. While we were unable to separate out specialty in our provider types, it’s also possible that certain specialties result in much higher alerting rates. For example, oncology orders are frequently overdoses based on globally-applied medication rules; these rules apply across the hospital and cannot be tailored to a specific specialty, which creates varying salience rates across different subspecialties. Salience is likely heavily workflow-related; batch-ordering on rounds by one provider, signing preliminary orders for pre-op, etc, may give rise to very different salience rates. Individual, practice, and specialty salience rates need additional study.
The time of day heavily influenced the provider salience to alerts. The time of day is likely highly correlated with the number of orders written during that time and this tends to be highest in morning hours. A large portion of orders are written on morning rounds and have associated time pressures and would appear as more batch orders. The alert response to day of week is also interesting. It may be related to clinical schedules and overall patient volumes. While the fellows’ salience rate varied more than the resident rate, it is possible that this is due to the structure of fellowship training. The first year of fellowship training is heavily clinical, typically followed by years of being heavily engaged in laboratory and research studies, with less time spent in practice.
Our study has several important limitations. One of these is that if multiple alerts are presented simultaneously a single user action can be attributed to all of the presented alerts. However, the median number of alerts per ordering session is only 1 in our institution (with 67% of ordering sessions contain only one order), which minimizes the risk of false attribution. The user response to alerts is likely very complex and multi-factorial in nature and we have tried to control for some of this by including environmental elements such as time of day in the analysis. Salience rates can be evaluated based on many factors including large alert categories (dose, interactions, and allergies), provider types, time and date, and the specific content of the alert such as the wording and recommendations. The content of the alert (beyond the alert type) was not analyzed in this study (for analytic scalability and practicality reasons) and is a known key driver for user acceptance. Further study is this area will be crucial to understanding the role the findings in this study has in the bigger picture. Another limitation is that alerts may be overridden appropriately, and as such, not all overridden alerts should be considered direct evidence of false positive alerting. While it is possible that there is a valid clinical reason for overriding a specific alert, we know that the number of dosing alerts that fire are predominantly custom rules so they are more likely to be accurate in a pediatric setting. Another potential limitation is the lack of assessing specific provider specialty, such as oncology, which could be a predictor of alert salience. While the study presents interesting findings, the findings can only be abstracted to our one situation and result in potentially over-simplifying the interpretation.
While the results are interesting, this is a starting point for further inquiry, and understanding the workflows that are generating the data will be critical. This is a foundational paper for those studies. We have statistically significant correlations, but there are other unmeasurable effects that we were not able to include. Future analysis should likely correlate the findings to help understand the relationship and predict user behavior for purposes of improving clinical care and patient outcomes.
6. Conclusion
Providers respond to alerts at a low rate and responsiveness to alerts depends on time of day, alert type, and alert burden. We observed some unexpected associations that warrant further study. Alert type and burden play a role in influencing provider action to medication alerts.
Abbreviations
EHR – electronic health record; CDS – clinical decision support; CI – confidence interval; CPOE – Computerized Provider Order Entry; OR – Odds Ratio; SE – Standard Error
Multiple Choice Question
The effectiveness of the alerts on user behavior. Four alert rules (eRules) are evaluated for effectiveness and demonstrate the following characteristics. Which one has the highest Alert Salience Rate?
|
# Alerts Presented |
# Alerts Overridden |
# Alerts Heeded |
Salience Rate? |
|
|---|---|---|---|---|
|
a: eRule 1 |
100 |
90 |
10 |
|
|
b. eRule 2 |
200 |
190 |
10 |
|
|
c. eRule 3 |
100 |
70 |
30 |
|
|
d. eRule 4 |
200 |
170 |
30 |
Rationale: C. The Alert Salience Rate is defined as the number of orders that were canceled or modified (changed prescribing behavior) divided by the total number of alerts presented to users (opportunities to change behavior).When calculated, eRule 1 has a salience rate of 10%, eRule 2 is 5%, eRule 3 is 30%, and eRule 4 is 15%.
Conflicts of Interest
The authors declare that they have no conflicts of interest.
Acknowledgements
N/A
Institutional Review/Human Subjects
The study was approved by the institutional review board.
-
References
- 1 Jamoom E, Beatty P, Bercovitz A, Woodwell D, Palso K, Rechtsteiner E. Physician adoption of electronic health record systems: United States, 2011. NCHS Data Brief. 2012; 98: 1-8.
- 2 Blumenthal D, Tavenner M. The ,,meaningful use“ regulation for electronic health records. N Engl J Med 2010; 363 (06) 501-504.
- 3 Buntin MB, Jain SH, Blumenthal D. Health information technology: laying the infrastructure for national health reform. Health Aff (Millwood) 2010; 29 (06) 1214-1219.
- 4 Centers for Medicare and Medicaid Services. CMS Quality Measure Development Plan: Supporting the Transition to the Merit-based Incentive Payment System (MIPS) and Alternative Payment Models (APMs). Baltimore, MD: Centers for Medicare and Medicaid Services; 2016 [updated 2 May 2016;cited 18 May 2016]; Available from: https://www.cms.gov/Medicare/Quality-Initiatives-Patient-Assessment-Instruments/Value-Based-Programs/MACRA-MIPS-and-APMs/MACRA-MIPS-and-APMs.html
- 5 Marcotte L, Seidman J, Trudel K, Berwick DM, Blumenthal D, Mostashari F, Jain SH. Achieving meaningful use of health information technology: a guide for physicians to the EHR incentive programs. Arch Intern Med 2012; 172 (09) 731-736.
- 6 Stultz JS, Nahata MC. Computerized clinical decision support for medication prescribing and utilization in pediatrics. J Am Med Inform Assoc 2012; 19 (06) 942-953.
- 7 McCoy AB, Cox ZL, Neal EB, Waitman LR, Peterson NB, Bhave G, Siew ED, Danciu I, Lewis JB, Peterson JF. Real-time pharmacy surveillance and clinical decision support to reduce adverse drug events in acute kidney injury: a randomized, controlled trial. Appl Clin Inform 2012; 3 (02) 221-238.
- 8 Buntin MB, Burke MF, Hoaglin MC, Blumenthal D. The benefits of health information technology: a review of the recent literature shows predominantly positive results. Health Aff (Millwood) 2011; 30 (03) 464-471.
- 9 Chaudhry B, Wang J, Wu S, Maglione M, Mojica W, Roth E, Morton SC, Shekelle PG. Systematic review: impact of health information technology on quality, efficiency, and costs of medical care. Ann Intern Med 2006; 144 (10) 742-752.
- 10 Kern LM, Edwards AM, Pichardo M, Kaushal R. Electronic health records and health care quality over time in a federally qualified health center. J Am Med Inform Assoc 2015; 22 (02) 453-458.
- 11 Shah NR, Seger AC, Seger DL, Fiskio JM, Kuperman GJ, Blumenfeld B, Recklet EG, Bates DW, Gandhi TK. Improving acceptance of computerized prescribing alerts in ambulatory care. J Am Med Inform Assoc 2006; 13 (01) 5-11.
- 12 Singh H, Sittig DF. Measuring and improving patient safety through health information technology: The Health IT Safety Framework. BMJ Qual Saf 2016; 25 (04) 226-232.
- 13 Steele AW, Eisert S, Witter J, Lyons P, Jones MA, Gabow P, Ortiz E. The effect of automated alerts on provider ordering behavior in an outpatient setting. PLoS Med 2005; 2 (09) e255.
- 14 Office of the National Coordinator for Health Information Technology, Charles D, Gabriel M, Furukawa M. ONC Data Brief: No. 16. Adoption of electronic health record systems among U.S. non-federal acute care hospitals: 2008–2013. May 2014 [cited 18 May 2016]; Available from: http://www.healthit.gov/sites/default/files/oncdatabrief16.pdf
- 15 Lee EK, Mejia AF, Senior T, Jose J. Improving Patient Safety through Medical Alert Management: An Automated Decision Tool to Reduce Alert Fatigue. AMIA Annu Symp Proc 2010; 2010: 417-421.
- 16 Garg AX, Adhikari NK, McDonald H, Rosas-Arellano MP, Devereaux PJ, Beyene J, Sam J, Haynes RB. Effects of computerized clinical decision support systems on practitioner performance and patient outcomes: a systematic review. JAMA 2005; 293 (10) 1223-1238.
- 17 Kawamoto K, Houlihan CA, Balas EA, Lobach DF. Improving clinical practice using clinical decision support systems: a systematic review of trials to identify features critical to success. BMJ 2005; 330 7494 765.
- 18 Kirkendall ES, Kouril M, Minich T, Spooner SA. Analysis of electronic medication orders with large overdoses: opportunities for mitigating dosing errors. Appl Clin Inform 2014; 5 (01) 25-45.
- 19 Ash JS, Sittig DF, Campbell EM, Guappone KP, Dykstra RH. Some unintended consequences of clinical decision support systems. AMIA Annu Symp Proc 2007: 26-30.
- 20 van der Sijs H, van Gelder T, Vulto A, Berg M, Aarts J. Understanding handling of drug safety alerts: a simulation study. Int J Med Inform 2010; 79 (05) 361-369.
- 21 Bates DW, Leape LL, Cullen DJ, Laird N, Petersen LA, Teich JM, Burdick E, Hickey M, Kleefield S, Shea B, Vander Vliet M, Seger DL. Effect of computerized physician order entry and a team intervention on prevention of serious medication errors. JAMA 1998; 280 (15) 1311-1316.
- 22 Bates DW, Teich JM, Lee J, Seger D, Kuperman GJ, Ma’Luf N, Boyle D, Leape L. The impact of computerized physician order entry on medication error prevention. J Am Med Inform Assoc 1999; 6 (04) 313-321.
- 23 Kaushal R, Barker KN, Bates DW. How can information technology improve patient safety and reduce medication errors in children‘s health care?. Arch Pediatr Adolesc Med 2001; 155 (09) 1002-1007.
- 24 Kaushal R, Bates DW, Landrigan C, McKenna KJ, Clapp MD, Federico F, Goldmann DA. Medication errors and adverse drug events in pediatric inpatients. JAMA 2001; 285 (16) 2114-2120.
- 25 King WJ, Paice N, Rangrej J, Forestell GJ, Swartz R. The effect of computerized physician order entry on medication errors and adverse drug events in pediatric inpatients. Pediatrics 2003; 112 3 Pt 1 506-509.
- 26 Phansalkar S, Edworthy J, Hellier E, Seger DL, Schedlbauer A, Avery AJ, Bates DW. A review of human factors principles for the design and implementation of medication safety alerts in clinical information systems. J Am Med Inform Assoc 2010; 17 (05) 493-501.
- 27 Schedlbauer A, Prasad V, Mulvaney C, Phansalkar S, Stanton W, Bates DW, Avery AJ. What evidence supports the use of computerized alerts and prompts to improve clinicians’ prescribing behavior?. J Am Med Inform Assoc 2009; 16 (04) 531-538.
- 28 Koren G, Barzilay Z, Greenwald M. Tenfold errors in administration of drug doses: a neglected iatrogenic disease in pediatrics. Pediatrics 1986; 77 (06) 848-849.
- 29 Kozer E, Scolnik D, Macpherson A, Keays T, Shi K, Luk T, Koren G. Variables associated with medication errors in pediatric emergency medicine. Pediatrics 2002; 110 (04) 737-742.
- 30 Lesar TS. Tenfold medication dose prescribing errors. Ann Pharmacother 2002; 36 (12) 1833-1839.
- 31 McPhillips H, Stille C, Smith D, Pearson J, Stull J, Hecht J, Andrade S, Miller M, Davis R. Methodological challenges in describing medication dosing errors in children. In: Henriksen K, Battles JB, Marks ES, Lewin DI. editors. Advances in patient safety : from research to implementation. Rockville, MD: Agency for Healthcare Research and Quality; 2005 Feb. p. 213-223.
- 32 Wong IC, Ghaleb MA, Franklin BD, Barber N. Incidence and nature of dosing errors in paediatric medications: a systematic review. Drug Saf 2004; 27 (09) 661-670.
- 33 Kirkendall ES, Kouril M, Dexheimer JW, Courter JD, Hagedorn P, Szczesniak R, Li D, Damania R. Automated identification of antibiotic overdoses and adverse drug events via analysis of prescribing alerts and medication administration records [In press]. J Am Med Inform Assoc. 2016
- 34 Stultz JS, Porter K, Nahata MC. Prescription order risk factors for pediatric dosing alerts. Int J Med Inform 2015; 84 (02) 134-140.
- 35 Beccaro MA, Villanueva R, Knudson KM, Harvey EM, Langle JM, Paul W. Decision Support Alerts for Medication Ordering in a Computerized Provider Order Entry (CPOE) System: A systematic approach to decrease alerts. Appl Clin Inform 2010; 1 (03) 346-362.
- 36 van der Sijs H, Aarts J, Vulto A, Berg M. Overriding of drug safety alerts in computerized physician order entry. J Am Med Inform Assoc 2006; 13 (02) 138-147.
- 37 Coleman JJ, van der Sijs H, Haefeli WE, Slight SP, McDowell SE, Seidling HM, Eiermann B, Aarts J, Ammenwerth E, Slee A, Ferner RE. On the alert: future priorities for alerts in clinical decision support for computerized physician order entry identified from a European workshop. BMC Med Inform Decis Mak 2013; 13: 111.
- 38 Ruppert D, Wand MP, Carroll RJ. Semiparametric regression. Cambridge series in statistical and probabilistic mathematics. Cambridge ; New York: Cambridge University Press; 2003. Chapter 11. p. xvi, 386 p.
- 39 Ngo L, Wand MP. Smoothing with Mixed Model Software. J Stat Softw 2004; 9 (01) 54.
- 40 Dewan M, Wolfe H, Young C, Desai B. Payer formulary alerts as a cause of patient harm and the journey to change them. Hosp Pediatr 2016; 6 (09) 529-535.
- 41 Horsky J, Zhang J, Patel VL. To err is not entirely human: complex technology and user cognition. J Biomed Inform 2005; 38 (04) 264-266.
- 42 Cash JJ. Alert fatigue. Am J Health Syst Pharm 2009; 66 (23) 2098-2101.
- 43 Harper MB, Longhurst CA, McGuire TL, Tarrago R, Desai BR, Patterson A. Core drug-drug interaction alerts for inclusion in pediatric electronic health records with computerized prescriber order entry. J Patient Saf 2014; 10 (01) 59-63.
- 44 Simpao AF, Ahumada LM, Desai BR, Bonafide CP, Galvez JA, Rehman MA, Jawad AF, Palma KL, Shelov ED. Optimization of drug-drug interaction alert rules in a pediatric hospital‘s electronic health record system using a visual analytics dashboard. J Am Med Inform Assoc 2015; 22 (02) 361-369.
- 45 Sittig DF, Wright A, Osheroff JA, Middleton B, Teich JM, Ash JS, Campbell E, Bates DW. Grand challenges in clinical decision support. J Biomed Inform 2008; 41 (02) 387-392.
Correspondence to
-
References
- 1 Jamoom E, Beatty P, Bercovitz A, Woodwell D, Palso K, Rechtsteiner E. Physician adoption of electronic health record systems: United States, 2011. NCHS Data Brief. 2012; 98: 1-8.
- 2 Blumenthal D, Tavenner M. The ,,meaningful use“ regulation for electronic health records. N Engl J Med 2010; 363 (06) 501-504.
- 3 Buntin MB, Jain SH, Blumenthal D. Health information technology: laying the infrastructure for national health reform. Health Aff (Millwood) 2010; 29 (06) 1214-1219.
- 4 Centers for Medicare and Medicaid Services. CMS Quality Measure Development Plan: Supporting the Transition to the Merit-based Incentive Payment System (MIPS) and Alternative Payment Models (APMs). Baltimore, MD: Centers for Medicare and Medicaid Services; 2016 [updated 2 May 2016;cited 18 May 2016]; Available from: https://www.cms.gov/Medicare/Quality-Initiatives-Patient-Assessment-Instruments/Value-Based-Programs/MACRA-MIPS-and-APMs/MACRA-MIPS-and-APMs.html
- 5 Marcotte L, Seidman J, Trudel K, Berwick DM, Blumenthal D, Mostashari F, Jain SH. Achieving meaningful use of health information technology: a guide for physicians to the EHR incentive programs. Arch Intern Med 2012; 172 (09) 731-736.
- 6 Stultz JS, Nahata MC. Computerized clinical decision support for medication prescribing and utilization in pediatrics. J Am Med Inform Assoc 2012; 19 (06) 942-953.
- 7 McCoy AB, Cox ZL, Neal EB, Waitman LR, Peterson NB, Bhave G, Siew ED, Danciu I, Lewis JB, Peterson JF. Real-time pharmacy surveillance and clinical decision support to reduce adverse drug events in acute kidney injury: a randomized, controlled trial. Appl Clin Inform 2012; 3 (02) 221-238.
- 8 Buntin MB, Burke MF, Hoaglin MC, Blumenthal D. The benefits of health information technology: a review of the recent literature shows predominantly positive results. Health Aff (Millwood) 2011; 30 (03) 464-471.
- 9 Chaudhry B, Wang J, Wu S, Maglione M, Mojica W, Roth E, Morton SC, Shekelle PG. Systematic review: impact of health information technology on quality, efficiency, and costs of medical care. Ann Intern Med 2006; 144 (10) 742-752.
- 10 Kern LM, Edwards AM, Pichardo M, Kaushal R. Electronic health records and health care quality over time in a federally qualified health center. J Am Med Inform Assoc 2015; 22 (02) 453-458.
- 11 Shah NR, Seger AC, Seger DL, Fiskio JM, Kuperman GJ, Blumenfeld B, Recklet EG, Bates DW, Gandhi TK. Improving acceptance of computerized prescribing alerts in ambulatory care. J Am Med Inform Assoc 2006; 13 (01) 5-11.
- 12 Singh H, Sittig DF. Measuring and improving patient safety through health information technology: The Health IT Safety Framework. BMJ Qual Saf 2016; 25 (04) 226-232.
- 13 Steele AW, Eisert S, Witter J, Lyons P, Jones MA, Gabow P, Ortiz E. The effect of automated alerts on provider ordering behavior in an outpatient setting. PLoS Med 2005; 2 (09) e255.
- 14 Office of the National Coordinator for Health Information Technology, Charles D, Gabriel M, Furukawa M. ONC Data Brief: No. 16. Adoption of electronic health record systems among U.S. non-federal acute care hospitals: 2008–2013. May 2014 [cited 18 May 2016]; Available from: http://www.healthit.gov/sites/default/files/oncdatabrief16.pdf
- 15 Lee EK, Mejia AF, Senior T, Jose J. Improving Patient Safety through Medical Alert Management: An Automated Decision Tool to Reduce Alert Fatigue. AMIA Annu Symp Proc 2010; 2010: 417-421.
- 16 Garg AX, Adhikari NK, McDonald H, Rosas-Arellano MP, Devereaux PJ, Beyene J, Sam J, Haynes RB. Effects of computerized clinical decision support systems on practitioner performance and patient outcomes: a systematic review. JAMA 2005; 293 (10) 1223-1238.
- 17 Kawamoto K, Houlihan CA, Balas EA, Lobach DF. Improving clinical practice using clinical decision support systems: a systematic review of trials to identify features critical to success. BMJ 2005; 330 7494 765.
- 18 Kirkendall ES, Kouril M, Minich T, Spooner SA. Analysis of electronic medication orders with large overdoses: opportunities for mitigating dosing errors. Appl Clin Inform 2014; 5 (01) 25-45.
- 19 Ash JS, Sittig DF, Campbell EM, Guappone KP, Dykstra RH. Some unintended consequences of clinical decision support systems. AMIA Annu Symp Proc 2007: 26-30.
- 20 van der Sijs H, van Gelder T, Vulto A, Berg M, Aarts J. Understanding handling of drug safety alerts: a simulation study. Int J Med Inform 2010; 79 (05) 361-369.
- 21 Bates DW, Leape LL, Cullen DJ, Laird N, Petersen LA, Teich JM, Burdick E, Hickey M, Kleefield S, Shea B, Vander Vliet M, Seger DL. Effect of computerized physician order entry and a team intervention on prevention of serious medication errors. JAMA 1998; 280 (15) 1311-1316.
- 22 Bates DW, Teich JM, Lee J, Seger D, Kuperman GJ, Ma’Luf N, Boyle D, Leape L. The impact of computerized physician order entry on medication error prevention. J Am Med Inform Assoc 1999; 6 (04) 313-321.
- 23 Kaushal R, Barker KN, Bates DW. How can information technology improve patient safety and reduce medication errors in children‘s health care?. Arch Pediatr Adolesc Med 2001; 155 (09) 1002-1007.
- 24 Kaushal R, Bates DW, Landrigan C, McKenna KJ, Clapp MD, Federico F, Goldmann DA. Medication errors and adverse drug events in pediatric inpatients. JAMA 2001; 285 (16) 2114-2120.
- 25 King WJ, Paice N, Rangrej J, Forestell GJ, Swartz R. The effect of computerized physician order entry on medication errors and adverse drug events in pediatric inpatients. Pediatrics 2003; 112 3 Pt 1 506-509.
- 26 Phansalkar S, Edworthy J, Hellier E, Seger DL, Schedlbauer A, Avery AJ, Bates DW. A review of human factors principles for the design and implementation of medication safety alerts in clinical information systems. J Am Med Inform Assoc 2010; 17 (05) 493-501.
- 27 Schedlbauer A, Prasad V, Mulvaney C, Phansalkar S, Stanton W, Bates DW, Avery AJ. What evidence supports the use of computerized alerts and prompts to improve clinicians’ prescribing behavior?. J Am Med Inform Assoc 2009; 16 (04) 531-538.
- 28 Koren G, Barzilay Z, Greenwald M. Tenfold errors in administration of drug doses: a neglected iatrogenic disease in pediatrics. Pediatrics 1986; 77 (06) 848-849.
- 29 Kozer E, Scolnik D, Macpherson A, Keays T, Shi K, Luk T, Koren G. Variables associated with medication errors in pediatric emergency medicine. Pediatrics 2002; 110 (04) 737-742.
- 30 Lesar TS. Tenfold medication dose prescribing errors. Ann Pharmacother 2002; 36 (12) 1833-1839.
- 31 McPhillips H, Stille C, Smith D, Pearson J, Stull J, Hecht J, Andrade S, Miller M, Davis R. Methodological challenges in describing medication dosing errors in children. In: Henriksen K, Battles JB, Marks ES, Lewin DI. editors. Advances in patient safety : from research to implementation. Rockville, MD: Agency for Healthcare Research and Quality; 2005 Feb. p. 213-223.
- 32 Wong IC, Ghaleb MA, Franklin BD, Barber N. Incidence and nature of dosing errors in paediatric medications: a systematic review. Drug Saf 2004; 27 (09) 661-670.
- 33 Kirkendall ES, Kouril M, Dexheimer JW, Courter JD, Hagedorn P, Szczesniak R, Li D, Damania R. Automated identification of antibiotic overdoses and adverse drug events via analysis of prescribing alerts and medication administration records [In press]. J Am Med Inform Assoc. 2016
- 34 Stultz JS, Porter K, Nahata MC. Prescription order risk factors for pediatric dosing alerts. Int J Med Inform 2015; 84 (02) 134-140.
- 35 Beccaro MA, Villanueva R, Knudson KM, Harvey EM, Langle JM, Paul W. Decision Support Alerts for Medication Ordering in a Computerized Provider Order Entry (CPOE) System: A systematic approach to decrease alerts. Appl Clin Inform 2010; 1 (03) 346-362.
- 36 van der Sijs H, Aarts J, Vulto A, Berg M. Overriding of drug safety alerts in computerized physician order entry. J Am Med Inform Assoc 2006; 13 (02) 138-147.
- 37 Coleman JJ, van der Sijs H, Haefeli WE, Slight SP, McDowell SE, Seidling HM, Eiermann B, Aarts J, Ammenwerth E, Slee A, Ferner RE. On the alert: future priorities for alerts in clinical decision support for computerized physician order entry identified from a European workshop. BMC Med Inform Decis Mak 2013; 13: 111.
- 38 Ruppert D, Wand MP, Carroll RJ. Semiparametric regression. Cambridge series in statistical and probabilistic mathematics. Cambridge ; New York: Cambridge University Press; 2003. Chapter 11. p. xvi, 386 p.
- 39 Ngo L, Wand MP. Smoothing with Mixed Model Software. J Stat Softw 2004; 9 (01) 54.
- 40 Dewan M, Wolfe H, Young C, Desai B. Payer formulary alerts as a cause of patient harm and the journey to change them. Hosp Pediatr 2016; 6 (09) 529-535.
- 41 Horsky J, Zhang J, Patel VL. To err is not entirely human: complex technology and user cognition. J Biomed Inform 2005; 38 (04) 264-266.
- 42 Cash JJ. Alert fatigue. Am J Health Syst Pharm 2009; 66 (23) 2098-2101.
- 43 Harper MB, Longhurst CA, McGuire TL, Tarrago R, Desai BR, Patterson A. Core drug-drug interaction alerts for inclusion in pediatric electronic health records with computerized prescriber order entry. J Patient Saf 2014; 10 (01) 59-63.
- 44 Simpao AF, Ahumada LM, Desai BR, Bonafide CP, Galvez JA, Rehman MA, Jawad AF, Palma KL, Shelov ED. Optimization of drug-drug interaction alert rules in a pediatric hospital‘s electronic health record system using a visual analytics dashboard. J Am Med Inform Assoc 2015; 22 (02) 361-369.
- 45 Sittig DF, Wright A, Osheroff JA, Middleton B, Teich JM, Ash JS, Campbell E, Bates DW. Grand challenges in clinical decision support. J Biomed Inform 2008; 41 (02) 387-392.