Keywords
dentists - occupational diseases - hearing loss provoked by noise
Palavras-chave
odontólogos - doenças profissionais - efeitos do ruído - perda auditiva provocada por ruído
Introduction
Noise is known as an agent aggressive to the ears common in work environment and responsible for Hearing Losses Induced by Noise (PAIR) in different branch of activities[1]. It is considered PAIR a hearing change with sensorioneural characteristic, cochlear, which affects especially the frequencies of 3000 to 6000Hz Hz, always almost bilateral and irreversible.
According to Brazilian Labor Legislation, Norm 15 - NR15[2], a work environment will be considered of risk to development of hearing loss when exceed 85dBA for a journey of 8 hours of work. In the Norm 17 - NR17[3], which is based on Brazilian Norm - NBR n. 10152[4], it is established that for purposes of acoustic comfort, the maximum level of noise in dental offices must be of 45dBA to 50dBA. Research showed that clinic, the offices and dental laboratories presented high sound pressure levels which lead, in time, impairments to the health of the professionals who work there, like as PAIR among others[5]
[6]
[7]
[8]
[9]
[10].
Study in Brazil found high level pressure of sound in the odontological equipments from a brand largely used, namely: in high rotation 65 to 78,6 dBA, in the amalgam 65,8 to 68 dBA, in sucker of high-power 68,8 a 72 dBA, in ultrasound for cleaning teeth 75,8 to 88 dBA and in the low speed engine 69,8 to 72 dBA[11].
Even if the noise level found in dental offices is not of sufficient intensity to cause hearing damages, it may cause discomfort and other non auditory symptoms to the professional[12]. Among the non auditory symptoms associated to the noise exposure there are changes involving neurological system, circulatory systems, digestive system, endocrine system, immunological system and psyche[13]. In study of 30 dental surgeons, of both of genders, it was found complaints possibly associated to exposure to noise: buzz (37%), insomnia (30%), headache (27%) and nausea (20%)[10].
Despite of the effects of the noise are preventable, the adoption of preventive measures among the dentist is still incipient. Among these measures there is the use of ear protection, still not completely incorporated among the dentist́s individual protection equipment[5]
[14].
Once that the dentist́s work environment present high level of noise, therefore, a risk to occur hearing losses, arises the need to comprehend better how they occur, aiming the precocious diagnosis and interventions.
Method
It is a study cross-section (or sectional) which analyzed the hearing thresholds of dentists (total of 115) of both of genders, at city of Curitiba / PR.
The criteria inclusion for this study was the dentist is active, voluntary, without compromise of external or middle ear and sign the Statement of Consent. The research was approved by the Ethics Committee of the proposing institution under n. 017/2008.
The dentists were submitted to the inspection of the external auditory and to tone audiometry of 500Hz to 8000Hz by airway and by bone conduction (If necessary, in other words, tone thresholds greater than air to 30 dBNA) using audiometer MAICO MA 41 (calibrated according to the pattern ANSI 1969) in acoustic cabin (calibrated by Norm I.S.O. 8253-1 of 1989), by a speech therapist, expert in audiology. It was considered the tone auditory threshold of 25dBNA in all of frequencies, as normal range. The dentists were questioned about current and previous diseases and morbid history which may cause hearing loss.
It excluded the cases with audiograms which indicated hearing loss of the type conductive and mixed, hearing disturbs associated to diseases or significative extra-occupational exposure.
We analyzed the tone hearing thresholds of group of dentists by gender, related to gender and time of service as dentist.
It was applied statistical procedures for data edition through the software Statistica - Release 7, and a survey of significant relationships and results of audiometry, considering if age and time of service to a significance of level de 0,05 (5%).
Results
It was analyzed the auditory thresholds of 115 dentists of both of gender, 55 (47,82%) of feminine gender and 60 (52,17%) of masculine gender.
The audiometry threshold revealed a change, with sensorioneural hearing loss, in 28 (24,34%) dentists, being 8 (14,54%) feminine gender and 20 (33,33%) of masculine gender. Through the proportion difference test, we can declare, the significance level 0,05 (5%), which the proportion of the subjects with hearing change it was significantly greater than the dentist of masculine gender (p = 0,0208).
The mean auditory threshold for each gender that was found are represented in the [Figures 1] e [2].
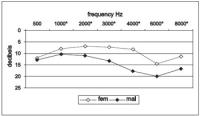 Figure 1. Mean auditory threshold, in both genders, to right ear (N = 115) (attached as image). OBS: * p <0,05
 Figure 2. Mean auditory threshold, in both genders, to left ear (N = 115) (attached as image). OBS: * p <0,05
Through T-Student test was observed significant difference between the genders, to the auditory threshold to the right in the frequencies of de 3.000Hz (p = 0,009), 4.000Hz (p = 0,001), 6.000Hz (p = 0,036) and 8.000Hz (p = 0,010).
Through T-Student test was observed significant difference between the genders, to the auditory threshold to the left in frequencies of 1.000Hz (p = 0,044), 2.000Hz (p= 0,008), 3.000Hz (p = 0,002), 4.000Hz (p = 0,000), 6.000Hz (p = 0,024) and 8.000Hz (p = 0,013).
Related to the variable age, the average among the dentists were of 40 years (DP= 4,2 years-old). In feminine gender, the average age was of 37,8 years-old (DP = 9,3) and in the masculine gender was of 42,9 years-old (DP = 11,7), occurring difference statistically significant between the gender related to the age (p = 0,002).
By analyzing the mean of the auditory threshold in function of age average, separated by gender, we observed the results presents on [Tables 1] and [2].
Table 1.
Correlation between age and auditory threshold in feminine gender (n = 55).
|
Ear and Frequency
|
Average
|
Standard Deviation
|
R
|
P
|
|
Age
|
Threshold
|
Age
|
Threshold
|
|
|
|
Right Ear
|
|
500
|
36,8
|
13,1
|
9,3
|
4,7
|
0,17
|
0,2235
|
|
1.000
|
36,8
|
9,3
|
9,3
|
4,9
|
0,18
|
0,1910
|
|
2.000
|
36,8
|
8,4
|
9,3
|
5,5
|
0,18
|
0,1891
|
|
3.000
|
36,8
|
6,9
|
9,3
|
6,0
|
0,37
|
0,0051*
|
|
4.000
|
36,8
|
9,4
|
9,3
|
6,9
|
0,40
|
0,0026*
|
|
6.000
|
36,8
|
14,2
|
9,3
|
7,9
|
0,17
|
0,2119
|
|
8.000
|
36,8
|
11,4
|
9,3
|
8,2
|
0,29
|
0,0335
|
|
Left Ear
|
|
500
|
36,8
|
12,1
|
9,3
|
4,9
|
-0,04
|
0,7493
|
|
1.000
|
36,8
|
8,0
|
9,3
|
4,6
|
0,21
|
0,1261
|
|
2.000
|
36,8
|
6,9
|
9,3
|
5,7
|
0,20
|
0,1411
|
|
3.000
|
36,8
|
7,2
|
9,3
|
5,7
|
0,28
|
0,0393*
|
|
4.000
|
36,8
|
8,3
|
9,3
|
6,2
|
0,39
|
0,0031*
|
|
6.000
|
36,8
|
14,4
|
9,3
|
8,2
|
0,47
|
0,0053*
|
|
8.000
|
36,8
|
11,3
|
9,3
|
8,5
|
0,46
|
0,0004*
|
Obs. Pearson's correlation. * level of significance 5%
Table 2.
Correlation between age and auditory threshold in masculine gender (n = 60).
|
Ear and Frequency
|
Average
|
Standard Deviation
|
R
|
P
|
|
Age
|
Threshold
|
Age
|
Threshold
|
|
|
|
Right Ear
|
|
500
|
43,0
|
13,9
|
11,8
|
12,0
|
0,16
|
0,2304
|
|
1.000
|
43,0
|
11,6
|
11,8
|
11,8
|
0,25
|
0,0600
|
|
2.000
|
43,0
|
10,6
|
11,8
|
11,4
|
0,47
|
0,0002*
|
|
3.000
|
43,0
|
12,8
|
11,8
|
15,0
|
0,54
|
0,0000*
|
|
4.000
|
43,0
|
16,8
|
11,8
|
15,1
|
0,55
|
0,0000*
|
|
6.000
|
43,0
|
19,7
|
11,8
|
16,6
|
0,63
|
0,0000*
|
|
8.000
|
43,0
|
18,0
|
11,8
|
16,4
|
0,63
|
0,0000*
|
|
Left Ear
|
|
500
|
43,0
|
12,8
|
11,8
|
5,2
|
O,45
|
0,0003*
|
|
1.000
|
43,0
|
10,2
|
11,8
|
6,6
|
0,55
|
0,0000*
|
|
2.000
|
43,0
|
11,1
|
11,8
|
10,0
|
0,53
|
0,0000*
|
|
3.000
|
43,0
|
13,1
|
11,8
|
13,3
|
0,54
|
0,0000*
|
|
4.000
|
43,0
|
17,8
|
11,8
|
14,6
|
0,62
|
0,0000*
|
|
6.000
|
43,0
|
20,0
|
11,8
|
16,0
|
0,60
|
0,0000*
|
|
8.000
|
43,0
|
18,2
|
11,8
|
18,3
|
0,40
|
0,0017*
|
Obs. Pearson's correlation. * level of significance 5%
Occurs a significant worsening (positive correlation) in auditory threshold to the age variable, in feminine gender, at the following frequencies: in the right ear in 3.000Hz, 4.000Hz and in the left ear in 3.000Hz, 4.000Hz, 6.000Hz and 8.000Hz; and in the masculine gender, in the right ear in 2.000Hz, 3.000Hz, 4.000Hz, 6.000Hz, 8.000Hz; and in the left ear from 500Hz to 8.000Hz. The auditory threshold in masculine presented the worst than the feminine gender, considering age.
The average time of service a dentist was of 16,6 year (DP = 3,5 years). In the feminine gender was of 14,1 years (DP = 9,9 years) and in the masculine gender of 18,8 years (DP = 10,7), occurring significative statistically difference between the genders related to the time of service (p = 0,0129).
The time of service in function of hearing profile, in both genders is represented in [Table 3].
Table 3.
Service time and hearing profile of dentists (N = 115).
|
Time (years)
|
Normal Hearing
|
Changed Hearing
|
Total
|
|
feminine
|
masculine
|
feminine
|
masculine
|
feminine
|
masculine
|
|
n
|
%
|
n
|
%
|
n
|
%
|
n
|
%
|
n
|
n
|
|
1 to 10
|
22
|
95,65
|
13
|
100,0
|
1
|
4,34
|
0
|
0
|
23
|
13
|
|
11 to 20
|
12
|
80,00
|
12
|
80,00
|
3
|
20,00
|
3
|
20,00
|
15
|
15
|
|
21 to 30
|
13
|
76,47
|
15
|
55,55
|
4
|
23,52
|
12
|
44,44
|
17
|
27
|
|
31 or more
|
−
|
−
|
0
|
0
|
−
|
−
|
5
|
100,0
|
−
|
5
|
The percentage of hearing changes related to the time of service was superior among men. From 21 years of time of service, observed a greater percentage of hearing changes in the group of masculine gender.
The auditory threshold mean in function of time of service as dentist, in both genders, are registered on [Tables 4] e [5].
Table 4.
Service time and mean hearing threshold in feminine gender, by Pearsońs correlation (n = 55).
|
Ear and Frequency
|
Average
|
Standard Deviation
|
R
|
P
|
|
Age
|
Threshold
|
Age
|
Threshold
|
|
|
|
Right Ear
|
|
500
|
14,1
|
13,1
|
9,3
|
4,7
|
0,14
|
0,2982
|
|
1.000
|
14,1
|
9,3
|
9,3
|
4,9
|
0,14
|
0,3115
|
|
2.000
|
14,1
|
8,4
|
9,3
|
5,5
|
0,16
|
0,2501
|
|
3.000
|
14,1
|
6,9
|
9,3
|
6,0
|
0,36
|
0,0066*
|
|
4.000
|
14,1
|
9,4
|
9,3
|
6,9
|
0,40
|
0,0025*
|
|
6.000
|
14,1
|
14,2
|
9,3
|
7,9
|
0,10
|
0,4741
|
|
8.000
|
14,1
|
11,4
|
9,3
|
8,2
|
0,22
|
0,1097
|
|
Left Ear
|
|
500
|
14,1
|
12,1
|
9,3
|
4,9
|
-0,06
|
0,6884
|
|
1.000
|
14,1
|
8,0
|
9,3
|
4,6
|
0,12
|
0,3668
|
|
2.000
|
14,1
|
6,9
|
9,3
|
5,7
|
0,13
|
0,3292
|
|
3.000
|
14,1
|
7,2
|
9,3
|
5,7
|
0,20
|
0,1367
|
|
4.000
|
14,1
|
8,3
|
9,3
|
6,2
|
0,36
|
0,0071*
|
|
6.000
|
14,1
|
14,4
|
9,3
|
8,2
|
0,31
|
0,0220*
|
|
8.000
|
14,1
|
11,3
|
9,3
|
8,5
|
0,38
|
0,0037*
|
* level of significance 5%
Tabela 5.
Service time and mean hearing threshold in masculine gender, by Pearsońs correlation (n = 60).
|
Ear and Frequency
|
Average
|
Standard Deviation
|
R
|
P
|
|
Age
|
Threshold
|
Age
|
Threshold
|
|
|
|
Right Ear
|
|
500
|
18,8
|
13,9
|
10,8
|
12,0
|
0,20
|
0,1348
|
|
1.000
|
18,8
|
11,6
|
10,8
|
11,8
|
0,24
|
0,0693
|
|
2.000
|
18,8
|
10,6
|
10,8
|
11,4
|
0,48
|
0,0001*
|
|
3.000
|
18,8
|
12,8
|
10,8
|
15,0
|
0,57
|
0,0000*
|
|
4.000
|
18,8
|
16,8
|
10,8
|
15,1
|
0,58
|
0,0000*
|
|
6.000
|
18,8
|
19,7
|
10,8
|
16,6
|
0,61
|
0,0000*
|
|
8.000
|
18,8
|
18,0
|
10,8
|
16,4
|
0,59
|
0,0000*
|
|
Left Ear
|
|
500
|
18,8
|
12,8
|
10,8
|
5,2
|
0,44
|
0,0005*
|
|
1.000
|
18,8
|
10,2
|
10,8
|
6,6
|
0,52
|
0,0000*
|
|
2.000
|
18,8
|
11,2
|
10,8
|
10,0
|
0,54
|
0,0000*
|
|
3.000
|
18,8
|
13,1
|
10,8
|
13,3
|
0,54
|
0,0000*
|
|
4.000
|
18,8
|
17,8
|
10,8
|
14,6
|
0,60
|
0,0000*
|
|
6.000
|
18,8
|
20,0
|
10,8
|
16,0
|
0,58
|
0,0000*
|
|
8.000
|
18,8
|
18,2
|
10,8
|
18,3
|
0,36
|
0,0049*
|
* level of significance 5%
Occurred significative correlation simultaneously between time of service and gender, being the masculine gender has a compromising in greater number of tonal frequencies in function of time of service.
It was investigated a daily work journey of dentists, being the average of 11 hours/day (DP = 2,8 hours) and there was not differences statistically significative between the genders for daily work journey (p = 0,1123).
Discussion
The dentist group studied (total 115) was composed by 52,17% men, which presented average age and time of service superior to the women.
It was observed sensorioneural hearing losses in 24,34% of dentists. Other studies with dentists in Brazil were found also sensorioneural hearing losses, but in greater percentage than this, such as study in Paraná, with 85 surgeon dentists, were found 43,5% with hearing changes[9]; in a study at Ribeirão Preto/SP[15] with 40 dentists of both genders, all of them with more than five years in profession, occurred 70% of hearing losses; and at Goiás, study with 228 dentists were found 31,58% with suggestive hearing changes of PAIR[16]. In the research performed with 30 surgeon dentists in both of genders, it was found 17% of hearing changes in high frequencies (3 and/or 4 and/or 6kHz), lower percentage than this study[10]. And, in a study performed in Belgium, the authors found hearing changes of 19,6% of dentists, especially in masculine gender[6].
The mean auditory threshold of dentists presented configuration of acoustic notch ([Figure 1] e [2]) and the significative differences between the genders related to the frequencies 3.000, 4.000, 6.000 e 8.000 Hertz bilaterally and in 1.000 e 2.000 Hertz in the left ear. It was found predominance of hearing changes in the men group (33,33%). Other studies analyzed hearing loss at work, with inferences from the gender, also it was observed the predominance of hearing changes in masculine gender with configuration of acoustic notch, typical of noise-induced hearing loss[17]
[18]. According to the literature[19]
[20]
[21]
[22], the hearing losses a work affect especially the masculine gender which, possibly, is more susceptible and more exposed to the factors of risk, when compared to feminine gender. It is estimated that the prevalence of hearing loss in adults in western industrialized countries of 77 by 1.000 in masculine gender 70 by 1.000 in feminine gender[23]. However, it should be considered that in this present study, the masculine gender presented superior age and time of service superior than the feminine gender, what may had influenced on results.
Time of service relates to the age. Several studies shows a progression of hearing thresholds due to the age and time of service, considering that the greater the length of service greater is the exposition to the occupational risks[17]
[24]
[25]
[26]
[27].
Studies show the effects of age and time of exposure to the noise (in years) about the worker, considering that the both effects overlap damaging the cochlea hair cells[24]
[28].
It was observed ([Tables 1] and [2]) that there is a significative worsening (positive correlation) in the auditory threshold to the age variable (with increasing age, the auditory threshold gets worse) in both genders, especially to the high frequencies which are more affected by the noise as well as to the aging.
Related to the time of service, in masculine gender occurred a greater percentage of hearing changes especially from 21 years of time of service ([Table 3]). Although, it is important to highlight that the men group of this study presented time of service superior than the women group, which it may interfered on the results. Some of the studies with other worker segments exposed to the noise, shows the development of PAIR after 10 years of work exposed to the intense noise, 8 hours a day[13]
[17].
In the auditory threshold analysis in function of length of service ([Tables 4] and [5]), the significative worsening (positive correlation), in feminine gender, occurred in high frequencies, in 3.000Hz and 4.000Hz in the right ear, considered by the literature the main affected by the noise; and 4.000Hz, 6.000Hz and 8.000Hz, in the left ear. And in masculine gender, it was affected a greater extension of frequencies (from 2.000Hz to 8.000Hz in right ear and in all of frequencies in left ear), what may characterize the influence of age together to the length of service. In study with workers exposed to noise was observed that age and time of service favored lowering of auditory threshold, as according of aging and length of service, more frequencies presented changes in audiogram[27]. In other study[17] with 5372 workers of masculine gender exposed to noise, 1019 (19%) presented hearing loss, from this 90,67% these are compatible with noise exposure, being the age group more affected over of 45 years (47,20% of PAIR), the time of exposure above 20 year with 51,20% of cases of PAIR. These findings are close to the found in this study, which found in masculine gender 54,44% of hearing changes after 21 years of service.
Related to the daily working hours, analyzed in hours, both of groups are similar and work in average 11 hours/daily, what may increase the risk of hearing changes depending on the daily dose of noise that they got exposed[13].
Conclusion
The dentists of this study presented mean auditory threshold with configuration in acoustic notch. The sensorioneural hearing losses were present in 24,34% of dentists, being that among masculine gender the changes were significantly superior (33,33%).
The auditory threshold worsen as aging and service time, being in the masculine gender these factors more impacting than in feminine gender. After 21 years of length of service, the hearing change percentage was greater in dentists of masculine gender.
The dentists of masculine gender in this study presented age and service time superior to feminine gender.
It is suggested that further studies comparing the auditory threshold between the genders involve a population more homogeneous related to the age and service time.


