

Subscribe to RSS
DOI: 10.1055/a-2481-6610
Best Practice Guidelines – DEGUM Recommendations on Breast Ultrasound
Part III/1 – Special Clinical Indications Article in several languages: English | deutschAuthors


Abstract
Breast ultrasound has been established for many years as an important method in addition to mammography for clarifying breast findings. The goal of the Best Practice Guidelines Part III of the DEGUM breast ultrasound working group is to provide colleagues working in senology with information regarding the specific medical indications for breast ultrasound in addition to the current ultrasound criteria and assessment categories published in part I and the additional and optional sonographic diagnostic methods described in part II. The value of breast ultrasound for specific indications including follow-up, evaluation of breast implants, diagnostic workup of dense breast tissue, diagnostic workup during pregnancy and lactation, and the diagnostic workup of breast findings in men is discussed. Each section after the general information section contains a description of specific pathologies followed by a short summary and DEGUM recommendations for the particular indications. The latest S3 guidelines and AGO guidelines were taken into consideration.
1. Breast ultrasound for follow-up
1.1 General information
Definition: According to the interdisciplinary S3 guidelines on the early detection, diagnosis, treatment, and follow-up of breast cancer (S3 guidelines), follow-up is performed “after completion of primary local treatment”. It includes structured examinations “with a focus on the early detection of locoregional or intramammary recurrence and contralateral breast cancer and on the targeted search for metastases in the case of symptoms or justified suspicion and late consequences of primary and long-term therapy” [1].
Duration: The follow-up period was extended from 5 years to 10 years in the guidelines due to the tumor biology of breast cancer [1].
Diagnostic imaging for follow-up: According to the S3 guidelines from 2021 and the AGO guidelines from 2023, breast ultrasound, in addition to mammography, is an essential part of early detection of both locoregional recurrence and contralateral breast cancer (S3 guidelines: EG B, LoE 2) (AGO: LoE 1a, GR A, AGO ++). According to the guidelines [1], patients who have had a breast cancer diagnosis should no longer be included in mammography screening, especially because a locoregional recurrence rate from 7 % to 20 % must be taken into consideration and an increased relative risk for contralateral breast cancer of 2.5 % to 5 % must be assumed [2].
Examination frequency: According to the S3 guidelines and the AGO guidelines, a breast ultrasound examination of the ipsilateral breast should be performed “at least” once a year during the first 3 years of follow-up in combination with mammography. The first mammogram of the affected side is performed 6 months after the end of radiation at the earliest. The contralateral breast is also examined once a year, at the earliest 12 months after the preoperative mammography examination. Beginning in the fourth year, mammography with supplementary ultrasound is recommended once a year for the ipsilateral as well as the contralateral breast. In the case of a low risk of recurrence, the mammography interval can be decreased to every 2 years after 10 years of follow-up. In the case of an average or high risk, annual follow-up continues [1]. In the case of ambiguities on mammography and/or ultrasound, MRI should be additionally performed [2].
It was shown that the recall and biopsy rates increased as a result of supplementary breast ultrasound in the follow-up period [3]. Most patients (82 %) feel positively about the additional examinations since the increased focus is associated with a higher sense of security [3]. In contrast to patient acceptance of ultrasound, only approx. two-thirds of patients undergo an annual mammography examination after primary surgery [4].
1.2 Specific pathologies
Detailed examination and documentation of the scars should be performed. When needed, split image documentation with and without compression can be used ([Fig. 1]). The advantage in the case of skin retractions or folds caused by scars is that these can usually be effectively visualized with hand-held ultrasound. It must be taken into consideration that a significant amount of ultrasound gel is used to achieve sufficient coupling even in the case of severe skin retractions. Doppler ultrasound should always be performed in addition to B-mode imaging. As an optional method, 3 D ultrasound, if available, can provide additional information like the canyon sign.

Mainly hematomas and seromas play a role in the early postoperative phase. In the case of symptoms, diagnostic ambiguity, or if needed prior to planned radiotherapy, these can be punctured under ultrasound guidance.
Fat necrosis (lipoid necrosis) is typically seen in the follow-up period. Its appearance is diverse ([Fig. 2]) and is usually difficult to evaluate without additional mammography information. Fat necrosis become increasingly liquefied over time resulting in so-called oil cysts ([Fig. 3]). Symptomatic oil cysts can be punctured and drained under ultrasound guidance. Fat necrosis can calcify over time causing persistent symptoms. Sonographic assessment is affected by changes in sound propagation. Comparison with a current mammography examination is recommended.


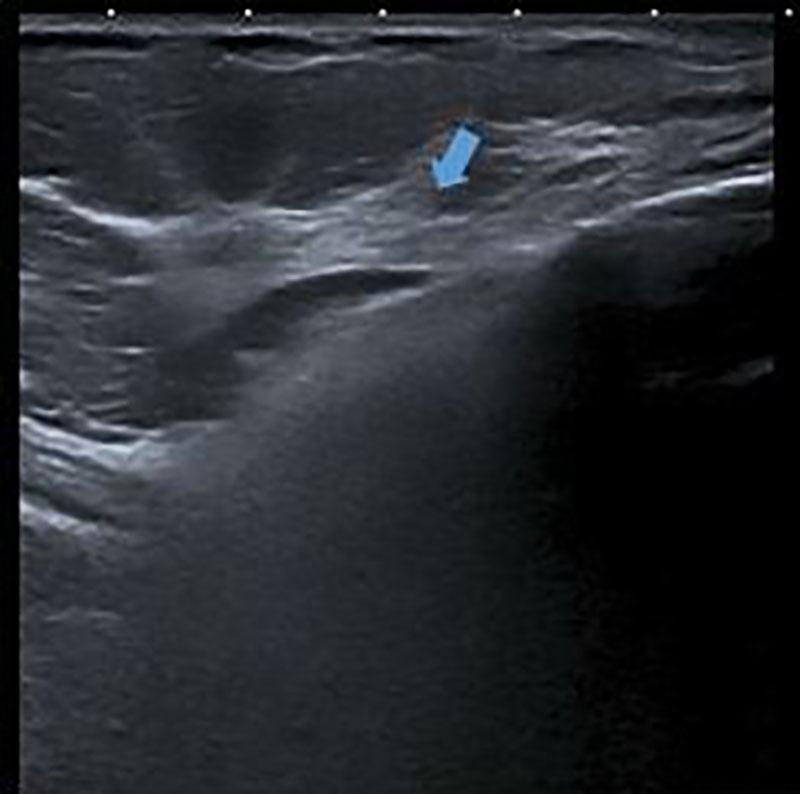
Both architectural distortion caused by scarring and fat necrosis are to be differentiated from recurrence. Similar to its presentation on mammography, recurrence can be seen as extra tissue as well as increased vascularization on Doppler ultrasound or contrast enhancement on contrast-enhanced ultrasound (CEUS). In the case of suspicion of recurrence in the area of the scar or suspicion of a second carcinoma, histological verification is required ([Fig. 4], [5], [6], [7]).


After the use of ablative treatment methods, ultrasound is the imaging method of first choice to rule out recurrence in the chest wall or to confirm this suspicion ([Fig. 8]). Examination and palpation findings can by further clarified by complementary use of ultrasound. Histological confirmation is needed in the case of suspicion.

Even after reconstruction with the patient's own tissue or implants, fat necrosis or recurrence can occur and must be differentiated from one another. In addition, in the case of implants, it is important to detect dislocation, rotation, capsular fibrosis, rupture, and indications of silicone leaks. Ultrasound is the diagnostic method of first choice for this purpose [5].
In the case of suspicion of a lymph node metastasis, it is necessary to determine whether lymph node metastasis was already detected during the primary diagnostic workup. Lymph node levels I-III are to be examined on a bilateral and comparative basis. In the case of abnormal lymph nodes, in addition to breast cancer metastases, lymphoma and lymph node metastases of another primary tumor should be considered for the differential diagnosis. Histological confirmation via ultrasound-guided punch biopsy should be performed [2]. In the case of confirmation, additional staging examinations must be performed.
In the axilla, the examiner should also pay attention to the possible presence of accessory breast parenchyma. Even after ablative procedures, residual breast parenchyma can be located there.
After the introduction of the sentinel lymph node technique (SLN), lymphedema has become less common but can still be detected to varying degrees. Pronounced lymphedema can weaken the acoustic energy to the extent that evaluation of low-lying structures can be difficult ([Fig. 9]). Lymphedema associated with thickening of the skin can sometimes be differentiated from cutaneous metastasis or lymphangitic carcinomatosis based on increased vascularization in the two latter cases. The clinical course and comparison with prior imaging provides important information.

After sonographic localization, suspicious skin changes can be histologically clarified in a targeted manner with punch biopsy.
1.3 Conclusion and DEGUM recommendations
In addition to inspection and palpation, the use of ultrasound as a supplement to mammography is an essential part of follow-up. The goal of regular follow-up is the early detection of recurrence and second carcinomas, both ipsilateral and contralateral.
-
According to the guidelines, structured follow-up examinations are to be performed over a period of 10 years.
-
Changes in scars should be additionally examined via Doppler ultrasound. Elastography as a supplementary modality and 3 D ultrasound as an optional modality can provide additional information.
-
An image comparison to mammography is to be recommended in the case of fat necrosis, scars, and lymphedema. Combined mammography and ultrasound evaluation increases the reliability of the differential diagnosis in the case of scars and calcification of scar tissue.
2. Breast ultrasound in the case of breast implants
2.1 General information
In addition to augmentation in plastic surgery, breast implants are used to correct malformations of the female breast and for reconstruction after ablative treatment of breast cancer. Globally, approx. 1.5 million implants are implanted each year, with approx. 67.000 of those being implanted each year in Germany.
Complications that can occur with implants and be diagnosed on ultrasound include: Implant rotation, implant wrinkling, intracapsular fluid (seroma), implant rupture, and silicone migration.
In an FDA study regarding the use of implants for breast surgery, a 10-year observation period showed that 5th generation implants have a defect in 12–14 % of cases and intra- and extracapsular silicone migration can occur. The FDA recommends MRI examinations of implants every two years so that complications, particularly implant defects, can be detected early [6].
For pragmatic reasons (availability of equipment, economic reasons), it is not possible to offer this examination to all women with implants. In addition, MRI examination of all women with implants is neither practical nor recommended in Germany, is not included in the service catalog of insurance companies, and is not logistically feasible.
Ultrasound achieves a high sensitivity (60–70 %) and specificity (80–85 %) compared to other methods for the imaging of implants and is only surpassed by MRI (96–100 % and 94–100 %, respectively) [5] [7] [8]. Therefore, ultrasound as a widely available and economical method is important for the primary diagnostic workup.
Ultrasound examination should be used to assess implant alignment in the case of anatomically shaped implants and to search for indications of implant defects and possible siliconomas [9].
The surrounding tissue should be examined separately from the implant on ultrasound. Complete examination of the implant with visualization of the anterior wall and if possible the posterior wall should be ensured. If available, panoramic imaging can be used for complete visualization.
2.2 Normal findings and specific pathology
Implant alignment
Implant manufacturers usually mark their products with stripes or points that can be identified on ultrasound. The alignment of the implant and the correct positioning can be visualized on the sagittal plane ([Fig. 10], [11], [12]) [10].


Intact implant
To be able to differentiate physiological from pathological changes, it is important to be familiar with the appearance of intact implants on ultrasound ([Fig. 13], [14]). In the initial years following implantation of an implant, the body naturally forms a fibrotic capsule around the implant. Radial folds in the implant can form over time due to shrinkage of the capsule. These must not be interpreted as signs of capsule rupture.


The extent of mirror image artifacts in the implant is determined by the slice thickness and density of the breast tissue. A symmetrical pattern can be expected in the side comparison in the case of intact implants ([Fig. 15]).

In the case of radial transducer orientation in an upper/outer preaxillary position, the prepectoral or retropectoral position of the implant can be determined ([Fig. 16]).

Wrinkling in the case of capsular fibrosis/capsular contracture
With progressive shrinking of the fibrotic capsule, pathological capsular contracture with subsequent deformation and increasing pain can occur.
According to Baker, there are four clinical grades of capsular fibrosis:
-
Baker I: Implant not palpable, not visible – soft breast, natural shape
-
Baker II: Implant palpable, not visible – breast slightly firmer, normal shape
-
Baker III: Implant palpable and visible – breast firm, deformation, no pain
-
Baker IV: Implant palpable, visible, dislocated – breast hard, deformation, pain
Wrinkling of the implant under the fibrotic capsule can be seen on ultrasound ([Fig. 17]). Diagnosis and particularly the assessment of the need to treat the capsular fibrosis are largely based on the clinical findings.

Implant rupture
A differentiation is made between intracapsular and extracapsular rupture [11].
Sonographic signs of intracapsular rupture include:
-
Debris sign – variations in echogenicity within the implant (inhomogeneous content). Intracapsular rupture results in silicone deposits within the capsule. These silicone deposits change the acoustic properties in the implant. Mirror image artifacts appear inhomogeneous ([Fig. 18], [19]).
-
Gel bleeding – intracapsular fluid (seroma around the implant with variations in echogenicity). The migration of silicone from inside the implant through the membrane results in intracapsular fluid. A thin border with variations in echogenicity between the membrane and the capsule is seen on ultrasound ([Fig. 20], [21]).
-
Stepladder sign – steps are formed in the region of the ruptured edge of the implant membrane. Discontinuous parallel linear echoes in the lumen of the implant are seen on the ultrasound image. This sign corresponds to the linguine sign on MRI and is considered the most reliable ultrasound finding in the case of intracapsular ruptures ([Fig. 22]).
-
Sandwich sign – free silicone between the capsule and the implant membrane ([Fig. 23]).
-
Snowstorm sign – strong reflection, hyperechoic appearance of the silicone accompanied by dorsal acoustic shadowing ([Fig. 24]).


Sonographic signs of extracapsular rupture include:
-
Formation of silicone granulomas – hypoechoic or hyperechoic masses. When replacing defective implants, silicone particles can remain. Silicone granulomas of varying size form and appear as hypoechoic or hyperechoic masses in the parenchyma. These can then be incorrectly interpreted as a sonographic indication of a current implant defect ([Fig. 25]). Early sonographic follow-up after an implant replacement can help to avoid misinterpretation. Any prior implant replacement must be recorded in the patient's medical history. This minimizes the probability of misdiagnosis of an implant rupture.
-
Extracapsular migration of silicone into the tissue – snowstorm sign, hyperechoic appearance, loss of contrast enhancement. In the case of extracapsular rupture, silicone migrates through the fibrotic capsule into the surrounding breast tissue. The ultrasound waves are reflected in an aberrant manner by the silicone particles. This results in a hyperechoic image with a loss of contrast enhancement and sonoanatomy and with the snowstorm sign ([Fig. 26], [27]).
-
Migration of silicone into the lymph nodes – snowstorm sign, hyperechoic hilum, loss of sonoanatomy. Silicone migrates not only into the surrounding breast tissue but also into the lymphatic vessels and begins to be deposited in the hilum of the lymph node. Typical signs of silicone migration into the lymph nodes are a hyperreflective hilum and the snowstorm sign. Silicone migration can affect the entire lymphatic system and can travel past level III to the parasternal region and beyond ([Fig. 28], [29], [30]). Surgical removal is only indicated in the case of symptoms.


Focal findings in patients with implants
The breast parenchyma is typically pressed against the skin envelope by a retroglandular or retropectoral position of the implant. As a result, the typical malignancy criteria on ultrasound like dorsal acoustic attenuation and vertical orientation can be falsified or not appear clearly. Axial ratios in malignant findings can change. The horizontal axis can then appear longer than the vertical axis ([Fig. 31]).

High-resolution close-up ultrasound with frequencies of over 12 MHz allows the narrow breast parenchyma border to typically be evaluated in a more differentiated manner than when using low sound frequencies.
Lymphadenopathy in the case of breast cancer in women with implants
As a result of silicone migration after implant rupture into the regional lymph nodes beyond level III into the cervical and/or parasternal lymph nodes, the status of the lymph nodes cannot be sufficiently evaluated on ultrasound. To reduce axillary morbidity, SLN removal should be discussed. In the case of a positive lymph node, the current clinical and morphological situation determines how to proceed ([Fig. 32]). It must be taken into consideration that the lymph nodes in women with implants are generally more difficult to evaluate even without silicone deposits and metastasis since reactive changes with enlargement of the cortex of the lymph nodes can often be seen.

Follow-up of women with implants
As in the primary diagnostic workup, silicone migration complicates the evaluation of the lymphatic system in follow-up examinations ([Fig. 33], [34]).

Breast implant-associated anaplastic large cell lymphoma (BIA-ALCL)
BIA-ALCL is associated with the implantation of textured silicone implants. If a seroma forms years after implantation of the implant (late seroma), it should be punctured and examined cytopathologically even if this diagnosis is suspected [12]. The incidence of BIA-ALCL specified in the AGO guidelines is currently approximately 0.6–1.2 per 100 000 cases ([Fig. 35]) [2].

2.3 Conclusion and DEGUM recommendations
With respect to the detection of implant-related complications, breast ultrasound has proven to be a readily available, cost-effective diagnostic method that is usually superior to mammography. It should be used as the primary diagnostic method for evaluating implants.
-
Complications like implant rotation, implant wrinkling in the case of capsular contracture, and intracapsular and extracapsular rupture with silicone migration into the capsule, breast tissue, and lymph nodes should be detected.
-
It must be taken into consideration that the typical criteria for detecting malignant findings both in the primary situation and in the follow-up period can be affected by the pressure of the implants on the overlying tissue.
-
In the case of an unclear late seroma around the implant capsule, rare late complications like BIA-ALCL should be considered and diagnosed accordingly.
3. Breast ultrasound in the case of dense breast parenchyma
3.1 General information
The glandular tissue is comprised of the terminal ductal lobular units (TDLU) responsible for lactation and the large milk ducts. Connective tissue and fat tissue surround the glandular tissue. Glandular tissue and connective tissue appear hyperechoic on ultrasound, while carcinomas often have hypoechoic structures ([Fig. 36]). Thus, there is echo contrast that usually allows effective diagnosis. In contrast, carcinomas are usually isodense or hyperdense on mammography compared to the glandular tissue and connective tissue and may be covered or masked by other tissue structures [13].

According to data from the German Mammography Screening Program, 46 % of women age 50 or older have heterogeneously dense breasts (parenchyma category c) ([Fig. 37]) and 6 % have extremely dense breasts (parenchyma category d) ([Fig. 38]) [14]. In the case of a dense breast parenchyma, the sensitivity of mammography can be reduced due to overlying layers or minimal contrast between the carcinoma and the surrounding tissue [15]. The guidelines recommend supplementary breast ultrasound to increase sensitivity in this situation. The denser the tissue, the more limited the ability to evaluate and detect a malignancy on mammography and the higher the risk [16] [17].


Breast ultrasound is able to detect mammographically occult cancers in approx. 4.4 cases per 1000 examinations [18]. Digital breast tomosynthesis (DBT) detects approx. 2 additional carcinomas per 1000 examined women [19] [20] [21] [22]. Ultrasound is significantly superior to DBT in the direct comparison, particularly in dense breasts (parenchyma categories c and d) ([Table 1]) [23] [24]. Evidence for the supplementary sonographic detection of mammographically occult cancers in dense breasts has already been provided in meta-analyses.
|
Detection rate (°/00) |
Recall rate (%) |
Biopsy rate (%) |
Interval cancer rate (°/00) |
|
|
Digital mammography[1] |
4.5–6.3* |
2.6–6.1* |
1.5–2.3** |
2.2–2.5*** |
|
Additional detection rate (°/00) |
Change in the recall rate (%) |
Biopsy rate (%) |
Interval cancer rate (°/00) |
|
|
Hand-held ultrasound[2] |
2.5–4.1 |
+ 5.9–10.1 |
0.3–8.5 |
0.5–3 |
|
Automated ultrasound[2] |
2.2–2.4 |
+ 0.9–13 |
0.7–3.6 |
No data |
|
Digital breast tomosynthesis[1] |
1.9–4.1* |
– 17–+ 46 |
1.1–2.6** |
0.5–1.2 |
|
Abbreviated MR-mammography[3] |
15–36.5*** |
+ 4.4–16.6 |
1.9–16.6 |
0–0.8 |
1 *6 European prospective studies: Skaane 2013, Ciatto 2018, Lang 2016, Pattacim 2018, Caumo 2018, Hofvindh 2018. **6 retrospective US studies: Rose 2013, Destoums 2914, Friedewald 2014, Greenberg 2014, McCarthy 2014, Conant 2016. *** Heidinger 2012.
2 Melnikow 2016, Rebolj 2018, Chong 2019, Vourtsis 2019.
3 Kühl 2014, Jam 2016, Chen 2017, Strahle 2017, Pamgrahi 2017, Choi 2018.
The increased detection rate with breast ultrasound results in the following disadvantages: lower positive predictive values for recall and biopsies, a greater false-positive rate, and an increase in psychological stress for the affected women compared to mammography alone [25] [26].
Under consideration of the necessary time, material, and personnel resources, the additional costs, and the increased stress for the affected women, the focus is currently on risk-adapted individual use. The ongoing DIMASOS-2 study (density-indicated mammographic-sonographic breast cancer screening) is examining the value of supplementary ultrasound for a dense breast parenchyma as part of the German Mammography Screening Program.
3.2 Specific case constellations
Extreme fibroglandular tissue (parenchyma category d, inhomogeneous with limited ability to be evaluated) presents a challenge for ultrasound and mammography. [27]. In these tissue structures, pronounced mastopathic changes and multiple, partially complicated cysts and the resulting inhomogeneities with acoustic shadowing can make diagnosis difficult. This can result in small carcinomas being masked. With the help of compression, color Doppler, elastography, 3 D ultrasound, and CEUS (contrast-enhanced ultrasound), additional information can be acquired [28].
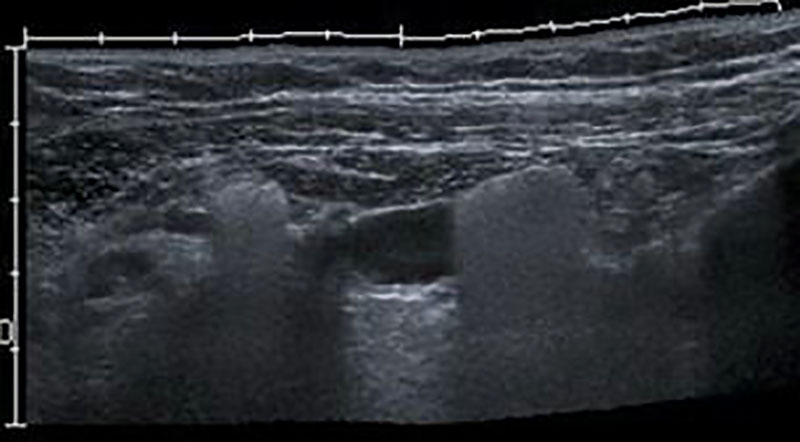
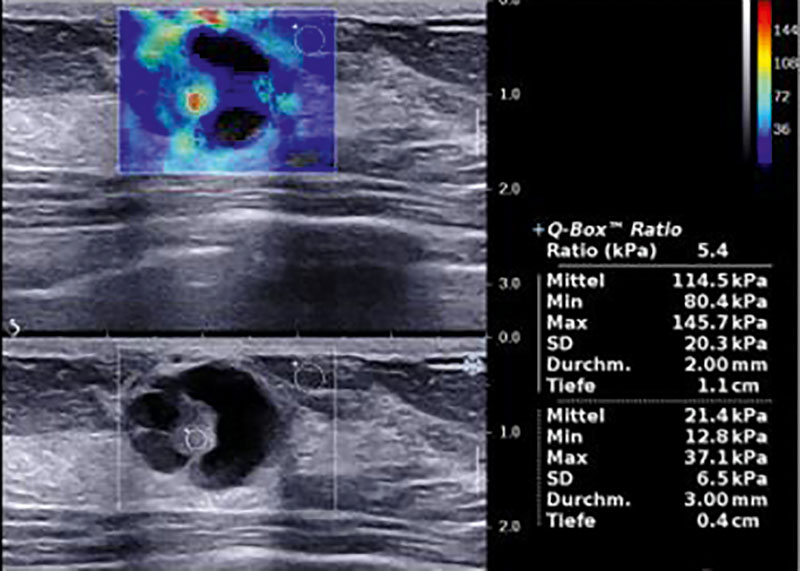
Complex cystic-solid lesions cannot always be reliably differentiated from complicated cysts in a dense breast parenchyma ([Fig. 39], [40]). Various positions, compression, supplementary Doppler ultrasound, elastography, and 3 D ultrasound, when applicable, can also be additionally used in these cases [28].

The sonographic differentiation of lobular breast cancer or LCIS/DCIS from mastopathic dense breast parenchyma often proves to be more difficult compared to NST cancer. MRI of the breasts can be helpful for the precise determination of the extent.
The detection of multifocality and multicentricity presents a particular challenge, especially in the case of a dense breast parenchyma that is difficult to evaluate. Equipment quality, optimal equipment function settings, appropriate ultrasound frequency, and the examiner's experience play an essential role here. Contrast-enhanced methods like MRI and contrast-enhanced MRI can also provide supplementary information here.
3.3 Conclusion and DEGUM recommendations
The use of breast ultrasound in addition to mammography increases the detection rate for breast cancer especially in dense breast parenchyma up to 40 % [25] [26] [29]. Another rationale for the use of ultrasound is to allow early detection and treatment of the cancer. The earlier the diagnosis and the smaller the cancer at the time of diagnosis, the better the prognosis for long-term patient survival.
The national S3 and AGO guidelines recommend supplementary ultrasound in addition to mammography in the case of increased breast density (LoE 2a) and increased breast cancer risk (LoE 1b) [1] [2].
-
Supplementary breast ultrasound is to be recommended in the case of mammographically dense breast tissue (parenchyma categories c and d).
-
Breast ultrasound should be performed by an examiner qualified and certified according to the DEGUM multilevel concept in order to increase specificity thereby keeping the number of unnecessary biopsies as low as possible.
-
To achieve the best possible diagnostic workup in the case of dense breast tissue that is difficult to evaluate, optimal ultrasound equipment settings should be used and equipment performance must be regularly checked. Supplementary breast ultrasound modalities going beyond B-mode imaging should be used.
This article was changed according to the Correction on March 26, 2025.
Correction
In the above-mentioned article the name of a coauthor was indicated incorrectly. Correct: Sebastian Wojcinski. This was corrected in the online version on March 26, 2025.
Conflict of Interest
The authors declare that they have no conflict of interest.
-
References
- 1 Leitlinienprogramm Onkologie (Deutsche Krebsgesellschaft, Deutsche Krebshilfe, AWMF): S3-Leitlinie Früherkennung, Diagnose, Therapie und Nachsorge des Mammakarzinoms, Version 4.4, Juni 2021, AWMF Registernummer: 032-045OL.
- 2 AGO Guidelines Breast: Diagnostik und Therapie früher und fortgeschrittener Mammakarzinome, Version 2023.1D (15.04.2023) Brustkrebs Nachsorge. Kolberg-Liedtke C. & Möbus V.
- 3 Wojcinski S, Farrokh A, Hille U. et al. Optimizing breast cancer follow-up: diagnostic value and costs of additional routine breast ultrasound. Ultrasound Med Biol 2011; 37 (02) 198-206
- 4 Doubeni CA, Field TS, Ulcickas YoodM. et al. Patterns and predictors of mammography utilization among breast cancer survivors. Cancer 2006; 106 (11) 2482-2488
- 5 Secco GM, Gutierrez PA, Secco VL. et al. Is breast utrasound a good alternative to magnetic resonance imaging for evaluating implant integrity?. Radiologia (Engl Ed) 2022; 64 (Suppl. 01) 20-27
- 6 https://www.fda.gov/MedicalDevices/DeviceRegulationandGuidance/PostmarketRequirements/PostApprovaStudies/default.htm
- 7 Gampper TJ Khoury H, Golllieb W. et al. Silicone gel implants in breast augmentation and reconstruction. Ann Plast Surg 2007; 59 (05) 581-590
- 8 Venta LA, Salomon CG, Flisak ME. et al. Sonographic signs of breast implant rupture. Am J Roentgenol 1996; 166 (06) 1413-1419
- 9 DeBruhl ND, Gorczyca DP, Ahn CY. et al. Silicone breast implants: US evaluation. Radiology 1993; 189 (01) 95-98
- 10 Hahn M, Kuner RP, Scheler P. et al. Sonographic criteria for the confirmation of implant rotation and the development of an implant-capsule-interaction (“interface”) in anatomically formed textured breast implants with texturised Biocell-surface. Ultraschall in Med 2008; 29 (04) 399-404
- 11 Lake E, Ahmad S, Dobrashian R. The sonographic appearances of breast implant rupture. Clin Radiol 2013; 68 (08) 851-858
- 12 von Fritschen U, Solbach C, Prantl L. Wie sicher sind Silikonimplantate?. Senologie 2019; 16: 92-93
- 13 Mundinger A, Bader W. Rolle der Sonografie bei der Früherkennung des Mammakarzinoms. Tumor.Diagn. u. Ther 2019; 40: 417-424
- 14 Weigel S, Heindel W, Dietz C. et al. Digitales Mammographie-Screening: Parenchymdichte und Programm-Sensitivität im Multicenter Ansatz. Abstractband. Deutscher Röntgenkongress 2018;
- 15 Kolb TM, Lichy J, Newhouse JH. Comparison of the performance of screening mammography, physical examination and breast ultrasound and evaluation of factors that influence them: an analysis of 27,825 patient evaluations. Radiology 2002; 225 (01) 165-175
- 16 Gießelmann K. Über die Dichte spricht man nicht. Deutsches Ärzteblatt 2015; 1118-1119
- 17 Müller-Schimpfle M, Brandenbusch VC, Degenhardt F. Zur Problematik der dichten Brust – AK Mammasonografie der DEGUM. Senologie 2016; 13: 76-81
- 18 Melnikow J, Fenton JJ, Whitlock EP. et al. Supplemental Screening fopr Breast Cancer in Women With Dense Breasts: A Systematic Review for the U.S. Preventive Services Task Force. Ann Intern Med 2016; 164 (04) 268-278
- 19 Gilbert FJ, Selamoglu A. Personalised screening: is this the way forward?. Clin Radiol 2018 Apr 73 (04) 327-333
- 20 Barr RG, Zhang Z, Cormack JB. et al. Probably benign lesions at screening breast US in a population with elevated risk: prevalence and rate of malignancy in the ACRIN 6666 trial. Radiology 2013; 269 (03) 701-712
- 21 Rebolj M, Assi V, Brentnall A. et al. Addition of ultrasound to mammography in the case of dense breast tissue: systematic review and meta-analysis. Br. J Cancer 2018; 118 (12) 1559-1570
- 22 Vourtsis A, Berg WA. Breast Density Implications and supplemental Screening. Eur Radiol 2019; 29 (04) 1762-1777
- 23 Tagliafico AS, Mariscotti G, Valdora F. et al. A prospective comparative trial of adjunct screening with tomosynthesis or ultrasound in women with mammography-negative dense breasts (ASTOUND-2). EUR J Cancer 2018; 104: 39-46
- 24 Berg WA, Rafferty EA, Friedewald SM. et al. Screening algorithms in dense breasts: Am J Roentgenol Expertppanel Narrative Review. Am J Roentgenol 2021; 216 (02) 275-294
- 25 Berg WA, Bandos AI, Mendelson EB. et al. Ultrasound as the Primary Screening Test for Breast Cancer: Analysis From ACRIN 6666. J Natl Cancer Inst 2015; 108 (04)
- 26 Ohuchi N, Suzuki A, Sobue T. et al. Sensitivity and specificity of mammography and adjunctive ultrasonography to screen for breast cancer in the Japan Strategic Anti-cancer Randomized Trial (J-START): a randomized controlled trial. Lancet 2016; 387: 341-348
- 27 Best Practice Guideline – Empfehlungen der DEGUM zur Durchführung und Beurteilung der Mammasonografie Teil I.
- 28 Best Practice Guideline – Empfehlungen der DEGUM zur Durchführung und Beurteilung der Mammasonografie Teil II.
- 29 Girardi V, Tonegutti M, Ciatto S. et al. Breast ultrasound in 22,131 asymptomatic women with negative mammography. Breast 2013; 22 (05) 806-809
Correspondence
Publication History
Received: 13 March 2024
Accepted after revision: 05 October 2024
Article published online:
14 January 2025
© 2025. Thieme. All rights reserved.
Georg Thieme Verlag KG
Oswald-Hesse-Straße 50, 70469 Stuttgart, Germany
-
References
- 1 Leitlinienprogramm Onkologie (Deutsche Krebsgesellschaft, Deutsche Krebshilfe, AWMF): S3-Leitlinie Früherkennung, Diagnose, Therapie und Nachsorge des Mammakarzinoms, Version 4.4, Juni 2021, AWMF Registernummer: 032-045OL.
- 2 AGO Guidelines Breast: Diagnostik und Therapie früher und fortgeschrittener Mammakarzinome, Version 2023.1D (15.04.2023) Brustkrebs Nachsorge. Kolberg-Liedtke C. & Möbus V.
- 3 Wojcinski S, Farrokh A, Hille U. et al. Optimizing breast cancer follow-up: diagnostic value and costs of additional routine breast ultrasound. Ultrasound Med Biol 2011; 37 (02) 198-206
- 4 Doubeni CA, Field TS, Ulcickas YoodM. et al. Patterns and predictors of mammography utilization among breast cancer survivors. Cancer 2006; 106 (11) 2482-2488
- 5 Secco GM, Gutierrez PA, Secco VL. et al. Is breast utrasound a good alternative to magnetic resonance imaging for evaluating implant integrity?. Radiologia (Engl Ed) 2022; 64 (Suppl. 01) 20-27
- 6 https://www.fda.gov/MedicalDevices/DeviceRegulationandGuidance/PostmarketRequirements/PostApprovaStudies/default.htm
- 7 Gampper TJ Khoury H, Golllieb W. et al. Silicone gel implants in breast augmentation and reconstruction. Ann Plast Surg 2007; 59 (05) 581-590
- 8 Venta LA, Salomon CG, Flisak ME. et al. Sonographic signs of breast implant rupture. Am J Roentgenol 1996; 166 (06) 1413-1419
- 9 DeBruhl ND, Gorczyca DP, Ahn CY. et al. Silicone breast implants: US evaluation. Radiology 1993; 189 (01) 95-98
- 10 Hahn M, Kuner RP, Scheler P. et al. Sonographic criteria for the confirmation of implant rotation and the development of an implant-capsule-interaction (“interface”) in anatomically formed textured breast implants with texturised Biocell-surface. Ultraschall in Med 2008; 29 (04) 399-404
- 11 Lake E, Ahmad S, Dobrashian R. The sonographic appearances of breast implant rupture. Clin Radiol 2013; 68 (08) 851-858
- 12 von Fritschen U, Solbach C, Prantl L. Wie sicher sind Silikonimplantate?. Senologie 2019; 16: 92-93
- 13 Mundinger A, Bader W. Rolle der Sonografie bei der Früherkennung des Mammakarzinoms. Tumor.Diagn. u. Ther 2019; 40: 417-424
- 14 Weigel S, Heindel W, Dietz C. et al. Digitales Mammographie-Screening: Parenchymdichte und Programm-Sensitivität im Multicenter Ansatz. Abstractband. Deutscher Röntgenkongress 2018;
- 15 Kolb TM, Lichy J, Newhouse JH. Comparison of the performance of screening mammography, physical examination and breast ultrasound and evaluation of factors that influence them: an analysis of 27,825 patient evaluations. Radiology 2002; 225 (01) 165-175
- 16 Gießelmann K. Über die Dichte spricht man nicht. Deutsches Ärzteblatt 2015; 1118-1119
- 17 Müller-Schimpfle M, Brandenbusch VC, Degenhardt F. Zur Problematik der dichten Brust – AK Mammasonografie der DEGUM. Senologie 2016; 13: 76-81
- 18 Melnikow J, Fenton JJ, Whitlock EP. et al. Supplemental Screening fopr Breast Cancer in Women With Dense Breasts: A Systematic Review for the U.S. Preventive Services Task Force. Ann Intern Med 2016; 164 (04) 268-278
- 19 Gilbert FJ, Selamoglu A. Personalised screening: is this the way forward?. Clin Radiol 2018 Apr 73 (04) 327-333
- 20 Barr RG, Zhang Z, Cormack JB. et al. Probably benign lesions at screening breast US in a population with elevated risk: prevalence and rate of malignancy in the ACRIN 6666 trial. Radiology 2013; 269 (03) 701-712
- 21 Rebolj M, Assi V, Brentnall A. et al. Addition of ultrasound to mammography in the case of dense breast tissue: systematic review and meta-analysis. Br. J Cancer 2018; 118 (12) 1559-1570
- 22 Vourtsis A, Berg WA. Breast Density Implications and supplemental Screening. Eur Radiol 2019; 29 (04) 1762-1777
- 23 Tagliafico AS, Mariscotti G, Valdora F. et al. A prospective comparative trial of adjunct screening with tomosynthesis or ultrasound in women with mammography-negative dense breasts (ASTOUND-2). EUR J Cancer 2018; 104: 39-46
- 24 Berg WA, Rafferty EA, Friedewald SM. et al. Screening algorithms in dense breasts: Am J Roentgenol Expertppanel Narrative Review. Am J Roentgenol 2021; 216 (02) 275-294
- 25 Berg WA, Bandos AI, Mendelson EB. et al. Ultrasound as the Primary Screening Test for Breast Cancer: Analysis From ACRIN 6666. J Natl Cancer Inst 2015; 108 (04)
- 26 Ohuchi N, Suzuki A, Sobue T. et al. Sensitivity and specificity of mammography and adjunctive ultrasonography to screen for breast cancer in the Japan Strategic Anti-cancer Randomized Trial (J-START): a randomized controlled trial. Lancet 2016; 387: 341-348
- 27 Best Practice Guideline – Empfehlungen der DEGUM zur Durchführung und Beurteilung der Mammasonografie Teil I.
- 28 Best Practice Guideline – Empfehlungen der DEGUM zur Durchführung und Beurteilung der Mammasonografie Teil II.
- 29 Girardi V, Tonegutti M, Ciatto S. et al. Breast ultrasound in 22,131 asymptomatic women with negative mammography. Breast 2013; 22 (05) 806-809


